

This is the third post in a new climatetippingoints.info series fact-checking claims that various climate tipping points have been crossed, and that sudden catastrophic warming is now inevitable. See the Introduction post for an overview.
Fact-Check: do tipping points and feedbacks commit us to rapid catastrophic warming?
Claim: More than 3°C of warming is already locked in over the next ~10 years even if we reduced or stopped emissions now, making catastrophic warming inevitable.
Reality: By 2030 we’ll likely reach an average of ~1.3-1.5oC. If all carbon emissions ceased now we’d reach ~1.4°C by 2100 (and more with reduced aerosol emissions), but our current trajectory is for far higher. Many of the values in committed warming lists are excessive, double-counted, or happen far slower than claimed.
There have been recent claims circulating (e.g. 1,2,3,4) that global warming is already higher than officially stated, and that even if we stopped human emissions now we’re already committed to a catastrophic or even runaway warming of 3 degrees celsius or more by around 2030. These claims often take the form of a list of feedbacks which have either been nearly or definitely triggered, and add up to a far larger number than commonly accepted.
In this post of climatetippingpoint.info‘s new Fact-Check series, we investigate how much warming we’re committed to and what role climate tipping points and feedbacks play. For each claimed source of committed warming, we add up running totals on the claimed warming and the likely actual warming between 2019 and 2030 at the top of each section
Drop the Baseline
Claim: Global warming is higher than officially stated, and is already at 1.2-1.5oC
[Claimed 2030 Running Total: 1.0oC +0.2 = 1.2oC]
Reality: Although total warming from pre-industrial is a bit higher, climate impacts, targets, and tipping points are measured relative to 1850-1900 because of better observational records from then onwards
[Actual 2030 Running Total: 1.0oC +0 = 1.0oC]
A common starting point is disputing the current level of warming on the basis that climate scientists take too late a baseline to measure warming from. The global average surface air temperature change (the key figure used to define “global warming”) from the average values between 1850 and 1900 (the baseline used by the last IPCC report, AR5) stood at about 1 to 1.1oC in 2019, or about 0.8 to 0.9oC above the also-common 1951-1980 baseline:

But some say we should measure this “pre-industrial” baseline from 1750 instead of 1850, and this would make current global warming be slightly higher at 1.2oC to 1.5oC (or even 1.6 to 1.9oC if you cherry-pick just the hot February in the record year of 2016, and not a recent multi-year average).
It’s true that 1850-1900 is after industrial emissions started and so doesn’t technically count as pre-industrial. And a recent scientific paper has made the case for using 1720-1800 as the best pre-industrial baseline definition, while another shows the difference is enough to significantly affect the Paris Target carbon budgets. But the reason this later period is often chosen is because many observational records were started between 1850 and 1880, making temperature estimates more accurate. This is why many of the climate models start from 1850 too, because they need high-quality input data that an earlier start-point can’t provide – it’s not a “little trick” to make warming seem smaller.
To further confuse matters, the Paris Targets of 1.5 to 2oC didn’t actually specify what baseline its targets are measured from. However, as the conference used the IPCC AR5 report it’s assumed to be 1850-1900 as well. This means the climate targets are measured to this baseline, as well as the climate impacts analysed in the IPCC reports and many tipping point estimates.
But more importantly, it doesn’t really matter exactly which baseline we use, as long as it’s consistent. The temperatures at which climate impacts and tipping points are projected to occur are defined relative to a chosen baseline, and using an earlier and lower baseline to measure from doesn’t move the impacts and tipping points as well.
As a result, even if warming is more like 1.2 to 1.5oC versus true pre-industrial rather than 1.0 to 1.1oC, the Paris Targets, IPCC climate impacts & carbon budgets, and most tipping point estimates are defined relative to the latter. For consistency, we’ll keep using the latter values (and for simplicity use 1oC as the 2019 baseline warming for our committed warming sums).
Lagging Behind
Claim: A large amount of warming from previous emissions hasn’t hit yet
[Claimed 2030 Running Total: 1.2oC +0.7 = 1.9oC]
Reality: There is a warming lag, but it’s smaller than stated as it’s partially balanced out by negative feedbacks
[Actual 2030 Running Total: 1.0oC +0.1, but already counted in the business-as-usual section below = 1.0oC. By 2100 it’d be +0.1-0.2oC, plus each decade of continued emissions with their associated lag]
The next step in the committed warming list is the warming from recently emitted CO2 that has yet had the chance to have its full impact yet. This is called the climate lag, and has been quoted at +0.5 to +0.7oC on top of the existing warming.
The idea here is that warming from increased CO2 doesn’t happen immediately – it takes time for energy imbalance CO2 causes to drive warming, time for the vast mass of the oceans to warm up, and time for this all to reach an equilibrium. This time lag between cause and most (~60%) of the effect is estimated at about 40 years (although the ocean will continue to slowly warm up for hundreds of years longer). Similarly, it was previously estimated that if human emissions immediately stopped, warming would continue to increase by +0.5 to +0.6oC* by 2100 [*IPCC, AR5, WG1, s12.5]. Based on this, it was thought that the 40 year mark might see ~0.4oC of warming.
We can also look directly at the actual energy imbalance driving warming known as Radiative Forcing (RF; measured in Watts per square metre of Earth’s surface), which in the last IPCC report in 2013 was estimated at +2.3 W/m². Assuming this forcing remains constant (i.e. keeping greenhouse gas and aerosol concentrations fixed) and using a transient climate sensitivity of 2oC per CO2 doubling, this translates to a near-term warming of ~1.2oC within the next few decades, versus the 2013 warming level of ~1oC. But on a longer timescale the equilibrium climate sensitivity is higher at around 3oC per CO2 doubling, leading to an eventual warming of more like ~1.6-1.8oC. On the timescales of thousands of years this would be higher still (the Earth system sensitivity), but for now we’re mostly worried about impacts this century. By 2019 this RF will have increased a bit too, with current warming now around 1.0 to 1.1oC.

However, if emissions were to cease immediately the forcing wouldn’t remain constant like this, with concentrations of short-lived gases like aerosols and methane rapidly dropping and some CO2 being drawn down into carbon sinks (somewhat countering the long-term warming from the ocean’s thermal inertia). The 2018 IPCC special report on 1.5 degrees concluded that these factors sufficiently counter the warming lag to still allow warming to be kept to around 1.5 degrees by 2100 with a gradual CO2 phase out. The report also found that if just CO2 emissions ceased now, there’s be a very gradual warming lag of ~0.1 degrees by 2100 (and would carry on thereafter as result of longer-term climate sensitivity), a lower figure than the ~0.5 degrees previously discussed based on maintaining constant atmospheric concentrations.
So, if we stopped emitting CO2 now we would still expect +0.1-0.2oC of warming over the next decades, with a bit more in store over the next few centuries as well as the climate system approaches it’s longer-term equilibrium. And this assumes an immediate stop to emissions, rather than a realistic peaking and then wind-down from current emission rates to zero. This is part of why plans to keep below the 1.5oC Paris target involve such a rapid and challenging decarbonisation process with a 45% emissions reduction by 2030 (and which if we miss then relies on extensive and controversial negative emission technologies), as this warming lag would require constant countering far into the future.
Sea Ice for More
Claim: Arctic sea ice disappearance will trigger a rapid jump in global warming
[Claimed 2030 Running Total: 1.9oC +0.5 = 2.4oC]
Reality: An ice-free Arctic summer will only lead to a small & gradual warming. So far it has likely added +~0.05oC (by 2007), and we might see a similar trend continue
[Actual 2030 Running Total: 1.0oC +0.05 (max. +0.2oC, but unlikely in next 10 years) = 1.05oC.]
Next up is the decline of Arctic summer sea ice (ASSI), where it’s claimed the loss of ASSI would lead to a rapid global warming of 0.5–1.0oC or more. As discussed in our in-depth Fact-Check on Arctic sea ice, in reality the loss of just summer sea ice would lead to more like a +0.1 to 0.2oC global warming increase, wouldn’t happen in one big jump, and is already captured by some of the last IPCC report’s model projections. Check out our previous post for more details.
Also linked here but not explicitly included in our target committed warming sums is the “Arctic Methane Bomb”, which is claimed to be capable of driving an abrupt 1-5oC jump in warming within only a few years. But as detailed in our in-depth Arctic Methane Fact-Check, the chance of a sudden catastrophic release of pure methane is negligible. A more gradual amplification of human-driven warming (0.15-0.3oC from permafrost by 2100 on low emission trajectories) is the most likely outcome, although even this is unwelcome.
Taking a Dim View
Claim: Global dimming is masking ~0.7oC of global warming, which will suddenly appear when decarbonisation starts as aerosol emissions decline
[Claimed 2030 Running Total: 2.4oC +0.7 = 3.1oC]
Reality: Global dimming masks around 0.6oC of global warming, but a total disappearance of aerosols in a year is unrealistic
[Actual 2030 Running Total: 1.0oC +0.1 this decade, but only if there’s rapid decarbonisation = 1.05-1.15oC]
Another common claim is that if humans reduced carbon emissions now we’d actually end up causing a rapid jump in warming (by 0.7oC or even 2.5oC in less than a year) as a result of something called global dimming. This refers to the cooling effect of tiny particles called aerosols, which humans emit as well as carbon from sources like power stations, factories, and fires. This has been posed as an unavoidable paradox, as by closing high emitters like coal-fired power stations in order to reduce greenhouse gas emissions we’d end up increasing temperatures and hitting tipping points anyway.
As discussed in more depth in our Fact-Check on Global Dimming, while the total removal of human-made aerosols would lead to a short-term warming of ~0.4oC (and ~0.6oC in the longer term), an abrupt end to all emissions is very unlikely. Decarbonisation will take decades, and aerosols come from a wide variety of sources beyond just the heaviest emitting power stations. Even a challenging target of halving aerosol emissions in the next couple of decades would only lead to ~0.2oC of warming – the equivalent of around a decade more of the current warming trend – which is preferable to carrying on emitting carbon indefinitely instead and is unlikely to trigger any tipping points.
Business Unusual
Claim: Business-as-usual human emissions will add +0.5oC in the next decade [Claimed 2030 Running Total: 3.1oC +0.5 = 3.6oC (or 2.9oC if no aerosol reductions)]
Reality: Temperature increases have consistently averaged at ~0.2oC per decade, and there’s no evidence to suggest a significant jump up in the warming rate now
[Actual 2030 Running Total: 1.05-1.15oC +0.2 = 1.25-1.35oC]
The next committed warming claim is that under business-as-usual emissions we might expect an additional 0.5oC of warming in the next decade. A rise this big sits far outside the current average warming rate of ~0.15-0.2oC per decade, and not much evidence has been given to support this claim apart from mentioning warming lags (explained earlier, and a process which is constantly ongoing and not new) and potential feedbacks (which are uncertain and unlikely to be as big as claimed, as discussed elsewhere in this series). Some decades have had slightly higher warming rates counterbalanced by other decades with slightly weaker warming (such as the so-called “global warming pause“), but the longer-term trend has so far remained pretty consistent:

Carbon emissions continue to increase and so we’d expect a similar increase in warming rate too, but there’s no reason to believe the emissions from the last decade would produce more than twice the warming per decade seen so far. So under Business-As-Usual emissions we can continue to expect around 0.2oC of warming per decade (with some decades warming faster and some slower), with the potential for a further gradual upwards creep in this value if emissions grow and extra feedbacks kick in.
Vapid Feedbacks
Claim: For every 1oC of extra warming commitments, another 1oC is added by the water vapour feedback, so this amplifies the previous warming sources
[Claimed 2030 Running Total: 2.9-3.6oC +1 = 3.9-4.6oC]
Reality: The water vapour feedback is already accounted for by climate sensitivity in models and calculations, so adding an extra 1oC is double-counting
[Actual 2030 Running Total: 1.25-1.35oC +0 = 1.25-1.35oC]
On top of the committed warming proposed so far, some lists add on an extra 1oC of warming from the water vapour feedback per 1oC of extra committed warming (adding up to an extra 1oC or even 2.1oC on the extra warming commitments). The basis of this idea is that as the atmosphere warms up due to CO2, this makes more water evaporate, and as water vapour is itself a powerful greenhouse gas this amplifies the original warming. But the claim of a doubling of the extra committed warming figures quoted so far is flawed.

To understand why, first of all we we need to think about climate sensitivity again. Without any extra feedbacks, a doubling of CO2 concentrations in the atmosphere would directly drive around 1oC of warming. But the longer-term equilibrium climate sensitivity is around 3oC per doubling of CO2. This extra 2oC mostly comes from positive feedbacks, of which around 1oC is due to water vapour (and so is the source of the 1oC extra warming per initial 1oC claim).
But this is per doubling of CO2, not per degree celsius of warming. A doubling of CO2 from the pre-industrial 280 parts per million (ppm) to 560 ppm (an increase of 280 ppm) would lead to ~3oC of global warming, but another doubling to 1120 ppm (an increase of 560 ppm) would also yield another ~3oC. This is because climate is more sensitive in a low CO2 world, like the one we currently live in.
But more importantly, this means the water vapour feedback is already included in all our projections of future climate change, as it’s already a key component of climate sensitivity calculations. The observed and projected ~0.2oC warming per decade implicitly includes the water vapour feedback already, as it is a constantly ongoing process that happens simultaneously with CO2-warming. In the same way, when we calculated the temperature impact of other positive feedbacks like the Arctic sea ice this also used the full climate sensitivity including the water vapour feedback.
As a result, adding an extra degree of warming on top of the extra commitments claimed is double-counting, as the impact of the water vapour feedback is already included in our global warming projections.
Forests Under Fire
Claim: At +3oC warming, the Amazon will burn down and add another +1.5oC [Claimed 2030 Running Total: 3.9-4.6oC +1.5 = 5.4-6.1oC]
Reality: Amazon dieback won’t suddenly happen at +3oC, and it’d add at most +0.2oC [Actual 2030 Running Total: 1.25-1.35oC + 0 (only significant beyond ~2oC) = 1.25-1.35oC]
Once the committed warming sums reach 3oC, it’s then claimed that this is the point when serious carbon cycle feedbacks like the massive release of Arctic Methane (discussed in the sea-ice section above) or the “Amazon burning down“. This latter point refers to the hypothesised dieback of the Amazon rainforest in a hotter and drier climate, and it’s claimed that this will add as much as another 1.5oC of warming. But this tipping point is not as sudden or as massive as is portrayed.
The source of this claim is based on scientists noticing that in many areas the landscape can support either a forest with near total tree cover or a savannah with mixed mostly grassland and some trees. What’s interesting is that the forest state is self-sustaining – it makes a lot of its own rain by recycling moisture, as each tree pumps up water which then evaporates and later becomes new rain upwind. But that means if enough forest is lost – through deforestation or climate change – at some point not enough moisture may get recycled any more, and the whole forest can dieback to a drier savannah instead:

There is evidence that this may at least partially be the case, but there isn’t evidence to suggest that this will happen suddenly when warming hits 3oC or release a huge amount of carbon. In various modelling studies the risk of Amazon dieback gradually grows above2oC and becomes significant in the 3 to 5oC range, but will still take 100-200 years to fully play out:

Then there’s the question of how much carbon this process will release. The video linked to claims 1.5oC of warming is possible, which would imply a CO2 increase of ~200 ppm. The total Amazon carbon sink is estimated to be 150-200 gigatonnes of carbon (GtC), with a maximum forest dieback to savannah estimated to release 53-70 GtC and raise atmospheric CO2 by 25-33 ppm (which is enough to cause up to ~0.15oC of warming if none of the CO2 was re-sequestered). It’s clear then that although this would be significant and unwelcome, it’s nowhere near the CO2 release that 1.5oC of warming would require. Even if all tropical and sub-tropical forests experienced dieback to savannah this would release ~191 GtC / ~90 ppm CO2, but this is even less likely to be a single global tipping point occurring specifically at +3oC. Dieback isn’t projected to be total even in the worst-case models either, with projected Amazon rainforest biomass shrinkage expected to be 24–40% (releasing 15-25 GtC) by 2100.
Overall, although the risk of Amazon dieback grows after reaching 2oC and becomes significant after 3 or 4oC, the warming caused by a total dieback is likely to be more modest (a maximum of ~0.15oC, and more like 0.1oC, instead of 1.5oC) and occur over a timescale of decades to centuries rather than years. A more likely gradual and partial dieback would cause up to ~0.05oC of global warming by 2100. As with many carbon cycle feedbacks, the issue is not that they’ll suddenly release a huge amount of carbon and cause abrupt warming. The issue is that they’ll shift from acting as net carbon sinks to net carbon sources, gradually adding carbon to the atmosphere instead of removing it as they do now.
Continental Drift
Claim: Continents will heat up twice as much as the global average, & ruin agriculture
[Claimed 2030 Running Total: 5.4-6.1oC x2 = 10.8-12.2oC experienced in continental interiors]
Reality: Continental interiors will warm up ~+0.5-1oC more than the ocean, not double [Actual 2030 Running Total: 1.25-1.35oC, but slightly more in continental interior (and twice as much in the Arctic), as is the case now]
Finally, a claim often tacked on to the end of extra committed warming lists is that continents will warm up twice as much as the ocean. This means the large committed warming claimed will actually be even more extreme where many people live, and importantly where most crops are grown.
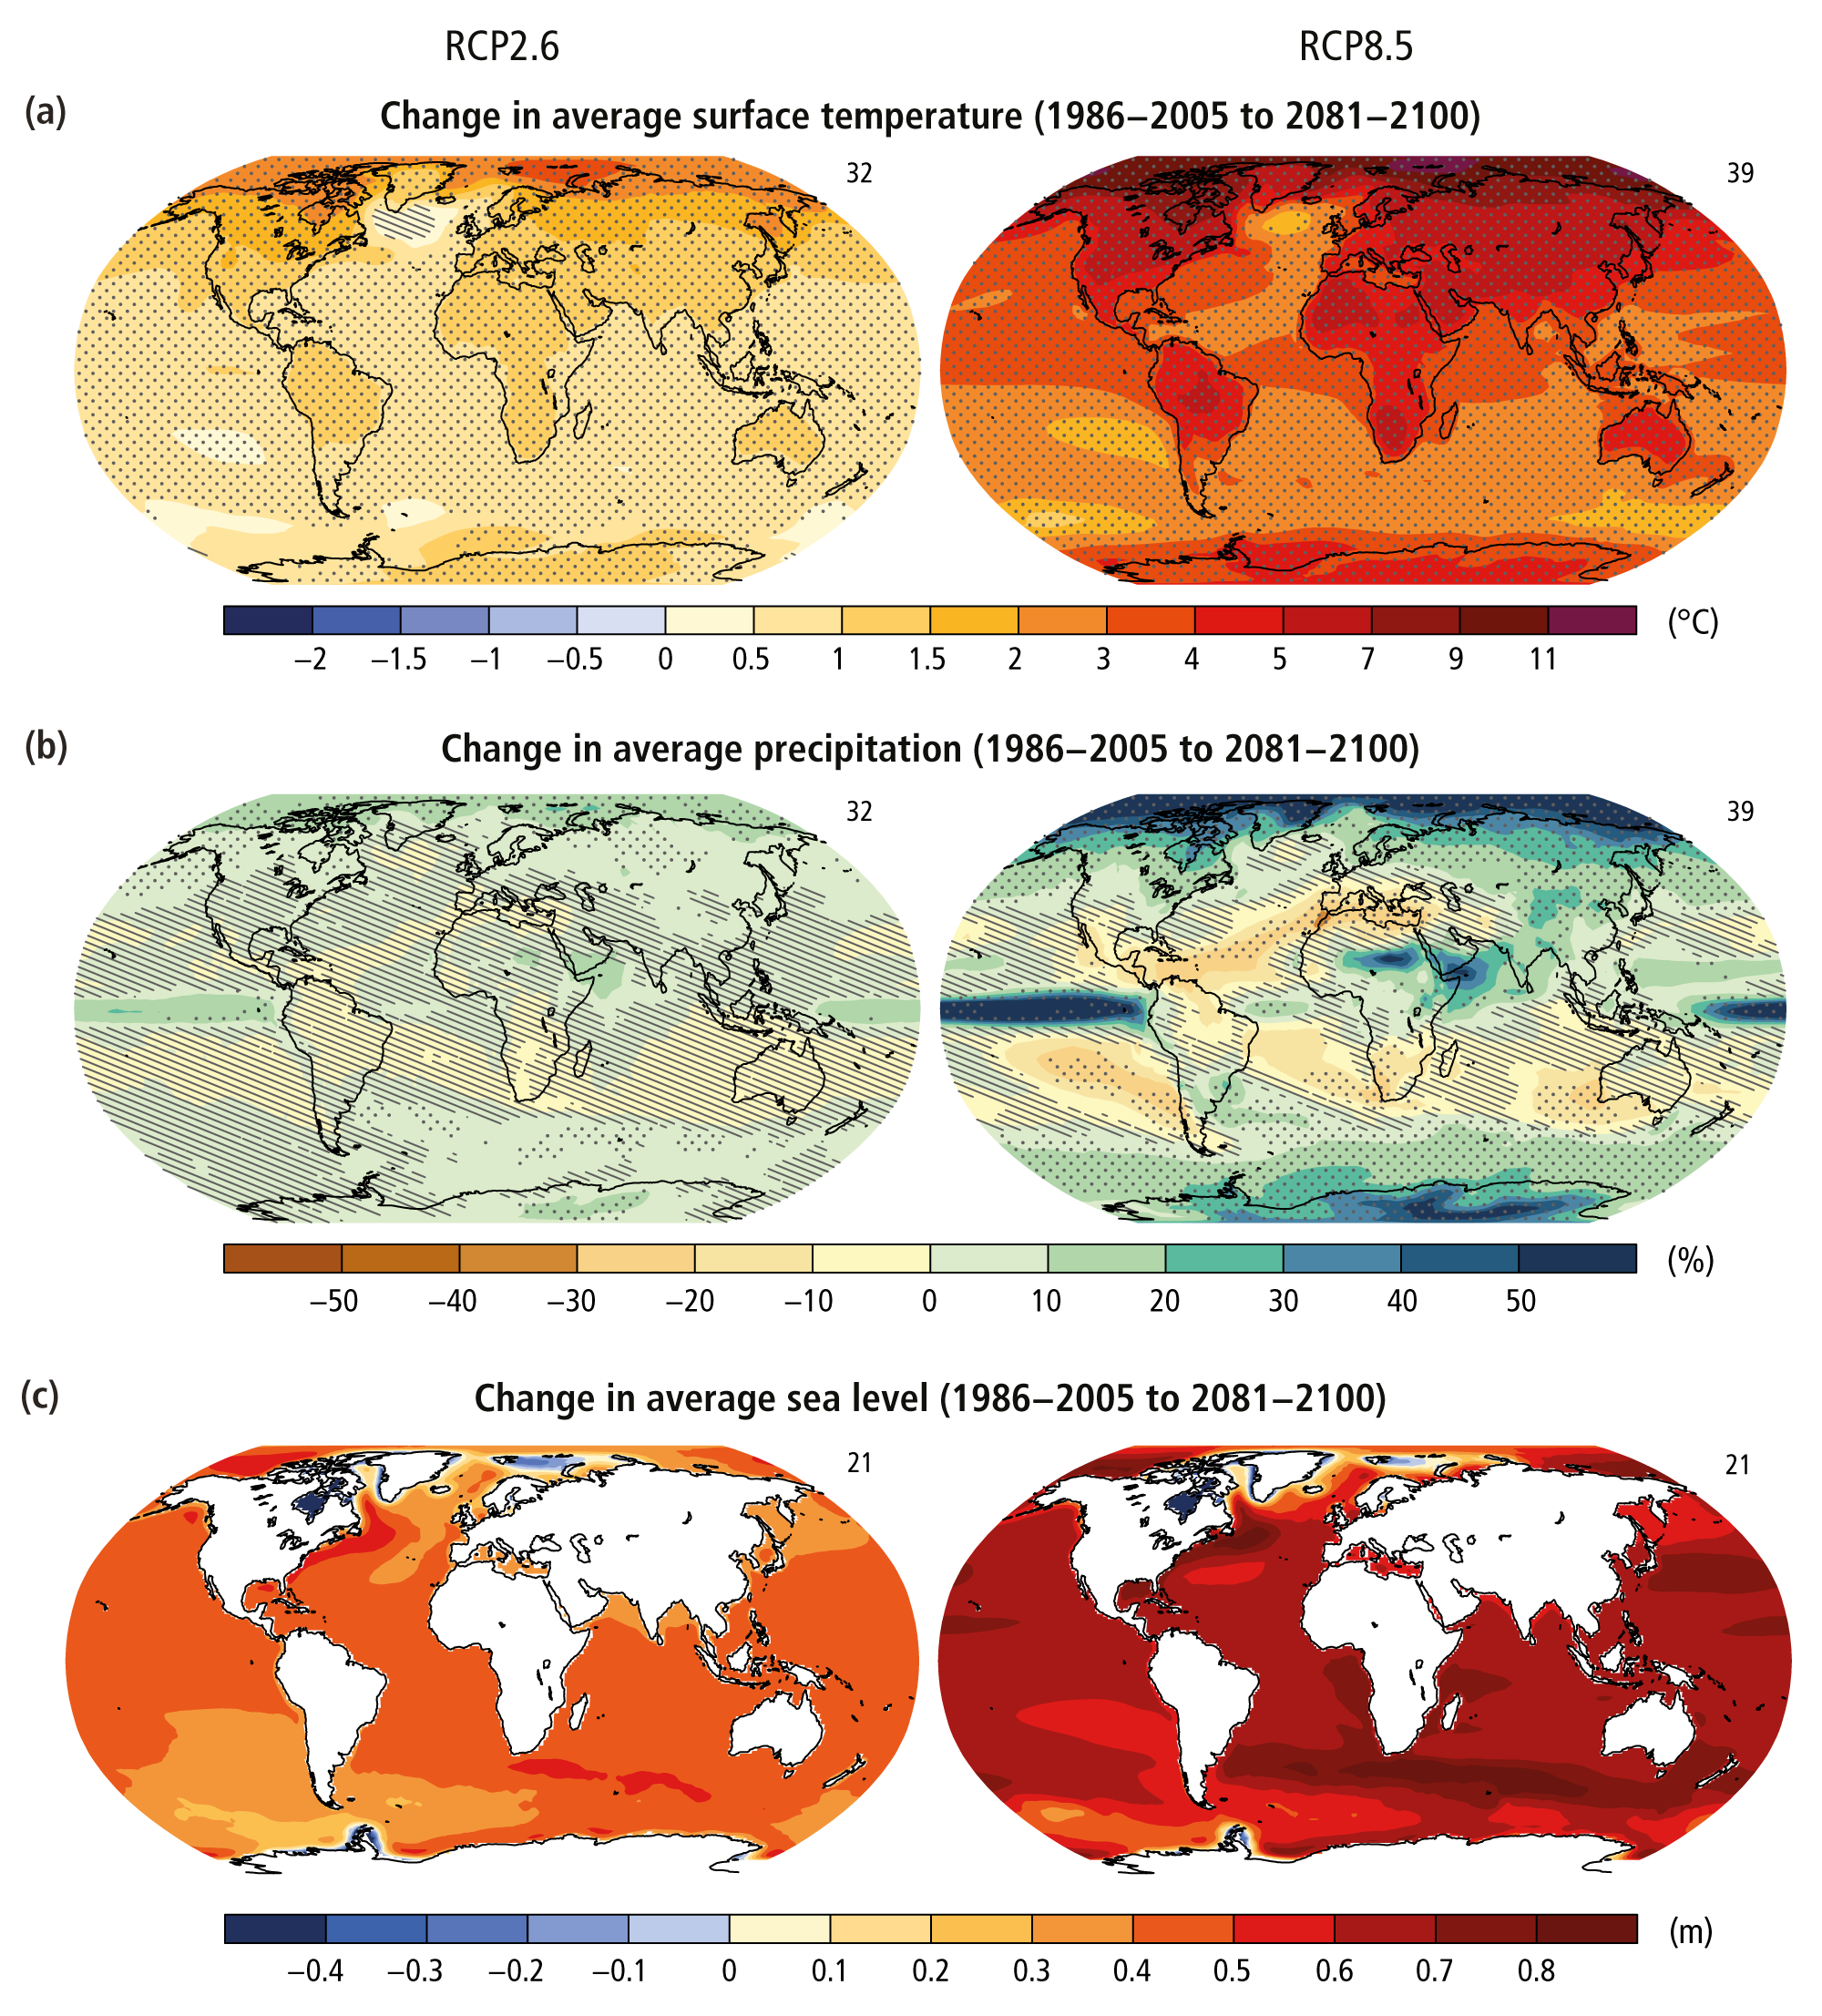
While it’s true that the land has warmed up more than the sea due to global warming, observations so far and climate model projections of the future do not show a doubling of temperatures. Under business-as-usual, projected warming by 2100 is expected to be up to 1oC more in continental interiors compared with a ~5oC warming overall – enough to further stress people and crops, but not as extreme as double:

Maps of projected future warming under low (left) and high (right) emission scenarios, showing slightly higher warming in continental interiors relative to the ocean (but not a doubling, except the Arctic). Dots mark areas with strong model agreement. Source: IPCC AR5
Summary
There are many positive feedbacks and tipping points which are claimed to be poised to rapidly make global warming far worse within only a few years. In this post we’ve gone through some of the cited sources of these “committed” warming claims, and found that the actual likely total is lower than sometimes stated:
- While the full warming from pre-industrial is probably a bit higher than the “official” 1oC, climate impacts and tipping points are defined relative to the latter
- There is a “climate lag” with ~0.1-0.2oC of warming (not ~0.5oC as often quoted, as this assumes fixed concentrations) yet to arrive by 2100, but this will happen gradually with only a fraction in the next ~10 years
- This figure of +0.2oC is also close to the current decadal warming rate, with no evidence for a jump up to +0.5oC in the next decade
- Global dimming is masking around 0.5-0.6oC of global warming, but even a rapid decarbonisation programme would only expose maybe +0.1oC of this anytime soon
- Arctic sea ice disappearing in the summer is unlikely in the next decade, and will cumulatively only add ~+0.1-0.2oC when it does. A “Methane Bomb” is also unlikely
- The water vapour feedback is already included in these projections, but is often double-counted
- And the Amazon forest won’t burn down at exactly +3oC of global warming, with its potential dieback to savannah gradually releasing around +0.1oC worth of carbon
When the influences of these factors and feedbacks are summed up, we might expect warming o reach around 1.3-1.5oC by ~2030 (maybe a bit more or maybe a bit less, with some years being high or low outliers), rather than the +3< or even +5< oC that is sometimes claimed. Even this is worth avoiding though – continued warming of around 0.2oC per decade of growing emissions plus the extra ~0.1oC lagging behind will put us past the 1.5oC Paris Target in only 10-20 years’ time, and past the 2oC Target around mid-century. Even if all emissions suddenly stopped now, without additional drawdown the warming lag would still push the warming up to ~1.2-1.3oC by 2100, plus a bit more from any aerosol reduction (which depends on extent, but maybe a temporary ~+0.2-0.3oC – see comment section for discussion). And the higher the warming goes, the more that feedbacks like Arctic sea ice, permafrost thaw, and Amazon dieback start to kick in. But these tipping points and feedbacks won’t trigger abrupt warming – instead they’ll act as new sources of extra gradual warming that make sticking to the Paris Targets even more challenging.
~
This post was written by Dr. David A. McKay, currently a Postdoctoral Researcher at Stockholm Resilience Centre (Stockholm University), where he is part of the Earth Resilience in the Anthropocene Project (funded by the European Research Council) and is researching non-linear climate-biosphere feedbacks. This post was written in his spare time with no funding support for this site, and was proofread and edited by Dr. Rachael Avery.
Post Update Log: 18/5/19 with a little extra information on the likely committed warming by 2100 – see comments for discussion – the Arctic sea-ice section was also updated to refer to the new Arctic Methane Fact-Check; 30/5/19 with additional details on the projected maximum Amazon dieback by 2100, as actual dieback is very unlikely to be total by 2100; 22/8/19 with clarification that the climate lag calculation is based on constant concentrations (not zero emissions), and updated to better reflect more recent lag calculations by IPCC SR1p5 (i.e. CO2 lag values revised down from ~0.5-0.6 to ~0.1-0.2 degrees by 2100); 3/12/19 with clarification that CO2->temperature calculations assume no re-sequestration, and so are maximum values (re-sequestration currently absorbs c. half of all emissions); 28/5/20 to specify 2019 and 1oC as the base year/warming for calculations; 26/10/20 to add extra paper to real pre-industrial discussion.

Hallo everybody,
I just read your „Fact-Check: do tipping points and feedbacks commit us to rapid catastrophic warming?”.
You are showing that “by 2030 we’ll likely reach an average of ~1.3 °C” and that the claim that “more than 3°C of warming is already locked in over the next ~10 years even if we reduced or stopped emissions now” is wrong.
I was interested which temperature we could reach if we would abrupt stop all emissions now.
I think it does not make any sense just to look what increase we will have in 2030 because 2030 is not the end of all days, hopefully.
As starting Temperature I take the “official” 1 °C.
Then you say there is a significant “climate lag” with ~0.6 oC of warming yet to arrive by 2100.
The next thing is the Arctic sea ice which will cumulatively “only” add ~+0.2oC when it’s disappearing in the summer.
The last thing is the dimming effect. I also had a look at your Fact-Check on this special issue. There you say that the total removal of human-made aerosols would lead to a short-term warming of ~0.4 oC (and ~0.6 oC in the longer term).
Adding those values while being optimistic:
1 °C + 0,6 °C + 0,2 °C + 0,4 °C = 2,2 °C
Wow! 2,2 °C are already locked in and will be reached by the end of the century when we stop all emissions now. This is beyond the 2 °C “target” where the tipping points and feedback loops will start to kick in and add additional temperature rise. Therefore it will probably be even more than 2,2 °C. Maybe it will be reached a little bit latter than 2100 when we keep on polluting the air long enough. But every single year we don’t reach net-zero emissions will lead to an even higher temperature increase at the end. Therefore we should better seek for zero emissions by tomorrow than any time later.
2,2 °C also means that the planet is very likely heading towards “Hothouse Earth” state. Not in 2030 of course and probably we will not live to see that anymore but the live of the next thousands of generations will be massively influenced and even human extinction is possible. Not only because of the heat but also because of the widespread damage this means to the ecosystems all over the world.
Please let me know if I double-counted any values and if you disagree with my conclusions.
Best wishes
Aaron
LikeLike
Hi Aaron, thanks for the comment. WordPress had put it in the spam comment folder, so I only just noticed it.
In the article I focused on warming by 2030 because I was focusing on the committed warming sums that Extinction Rebellion used in their earlier Heading for Extinction talks, suggesting at least 3°C of warming by 2030ish. But you’re right to say that the longer term warming beyond then is pretty important(!), and 2100 is a pretty standard benchmark to measure at.
On to the committed warming sums, starting at ~1-1.1°C now (vs. 1850-1900). The long-term lagged warming is definite and would reach ~+0.6°C by 2100. Sea ice disappearing could add up to another 0.2°C, but there’s a bit of double-counting here as some of its melt-back is already partially included within normal warming projections for 2100 (as part of the Equilibrium Climate Sensitivity feedbacks) and would only count as “extra” if it happened sooner than projected. But there could be some extra unexpected feedback from Arctic methane, which in the Arctic Methane Fact-Check under a low emission scenario I estimated to be ~0.15°C, maybe up to 0.3°C. If all anthropogenic aerosols permanently disappeared then there’d be another ~+0.6°C in the long-term. But this assumes *all* these aerosols disappear forever, which given that many of them come from non-industrial sources (like land use and cooking fires). This would be as challenging as bringing down carbon emissions to zero though (if not more so), and might also be phased out more gradually to limit the impact. So I’d estimate a smaller contribution from aerosols by 2100, although with quite a lot of uncertainty on exactly how much smaller.
So adding these long-term commitments up for 2100 we might expect another ~1-1.2°C or so of warming, mostly from the lagged warming (~0.6°C) with some from aerosol reduction as well if we assume moderate cleanup action (~0.2/0.3°C) and a bit from feedbacks like earlier than expected sea-ice melt or permafrost methane (~0.2/0.3°C). I make it then to a total of 2°C or a bit more by 2100, so pretty much the same as your count but with some slightly different elements. But this doesn’t include possible drawdown of carbon in the meantime, but that very much depends on human actions in the meantime.
This is of course why reducing emissions ASAP is so critical to staying on lower warming pathways, and why keeping to 1.5°C relies so much on hypothetical negative emissions to buy back some of that long-term committed warming. There are also some more potential feedbacks and tipping points beyond 2°C that this risks approaching and amplifying, but as alluded to in the article the risk of big feedbacks is not fully established yet [Disclaimer: I’m working on the project and team following-up from the Hothouse paper, so I’m working on it!].
LikeLike
Hi!
I would be very interested to hear more on the hothouse earth paper from climatetippingpoints.info. When could we possibly expect a piece on it?
Best regards
Moritz
LikeLike
Hi Moritz – it’s interesting you should ask about that paper, as I’m now part of the ERA project that produced that paper (which was its launch paper) and am currently working with its authors on follow-up papers to it, so I know a little bit of the background to how it was put together and what the authors were trying to show (and that might not have entirely been borne out in the reporting on it!).
I haven’t planned a specific post on it as of yet (I might well at some point though, as it triggers a lot of questions!), but in the meantime I would emphasise that its pitch was as a perspective/comment piece proposing a new hypothesis (that the risk of tipping points amplifying anthropogenic warming grows significantly after 2 degrees), which researchers like myself are now setting out to test in new research studies. It’s not yet the case that 2 degrees definitely marks some sort of sharp global tipping point that makes runaway to 4 degrees v. likely, but what we can say is that the more warming happens the more it will be partially amplified by various climate feedbacks and be progressively locked in by tipping points like a ratchet (with 2 degrees being a point beyond which we can be fairly sure more of this will happen than before, and 1.5 even less so). For the moment though tipping cascades remains a new hypothesis, which we’re now setting out to test and scrutinise.
LikeLike
Hi! I’m a bit confused by this reply and it’s relationship with the Paris Agreement temperature targets. So this means that the prospect of limiting warming under 2C has already slipped out of reach, even if we stopped emissions right now? If that is true, it seems like an underreported truth and one that would alter the conditions of the Paris Agreement. It would also make the climate change problem appear close to hopeless (at least in the sense that we are unable to prevent catastrophic warming), especially because the world seems so unlikely to follow a 1.5-2C pathway. If we are already committed to 2C by 2100, then it seems vanishingly unlikely that we will limit warming to under 3C as well. Again, this makes the climate change problem seem close to hopeless. Am I missing something here?
LikeLike
Hi HD, good question. Since writing this comment I actually updated the committed warming figures in my posts (see this section: https://climatetippingpoints.info/2019/04/15/fact-check-do-tipping-points-and-feedbacks-commit-us-to-rapid-catastrophic-warming/#climate_lag_check), as the original one I used (c. 0.6C) was actually just for a specific hypothetical scenario that held all greenhouse gas concentrations constant in models and seeing what happens. But in reality if we stopped all emissions then greenhouse gases wouldn’t stay constant, as methane would drop down fairly quickly and the natural carbon sinks (which currently take up around half our yearly emissions) would gradually take some of the CO2 out. The updated figures for this in the 2018 IPCC special report on 1.5C revised down the further committed warming to more like ~0.1C by 2100, which brings the sums in my comment down to more like ~1.5C committed by 2100 if we stopped all emissions now and did nothing else. This is comparable to the IPCC’s calculations for zero CO2/aerosol emissions (the solid green line in: https://climatetippingpoints.files.wordpress.com/2019/04/img_20190822_120354-1.jpg), but I’m assuming only partial aerosol removal countered by some extra carbon cycle feedbacks. So this would imply that roughly 1.5C is locked in rather than 2C, but this doesn’t take account of the potential of human-boosted drawdown (from natural climate solutions like reforestation) on the one hand, or that immediate zero GHG & aerosol emissions are unlikely on the other hand. I’d say that 1.5C at 2100 is still just about geophysically viable if rapid and deep action was taken (although possibly with a bit of overshoot mid-century), and that 2C is still achievable to – the tricky part is making it politically viable!
LikeLike
I’m confused about something. You say “Using a transient climate sensitivity of 2oC per CO2 doubling, this translates to a near-term warming of ~1.2oC within decade or two, versus the 2013 warming level of ~1oC. But on a longer timescale the equilibrium climate sensitivity is higher at around 3oC per CO2 doubling, leading to an eventual warming of more like ~1.8oC.” Since we were supposed to get to 1.2 degrees C in a decade or two, but now ECS is estimated as higher, does that mean we now get to 1.8 degrees C in a decade or two? Because you say later that we’re only getting to 1.5 in two decades. Does your conclusion that we’ll reach 1.5 in two decades take into account the higher ECS (which seems to be most likely at this point)?
LikeLike
Hi Arthur – So the transient and equilibrium climate sensitivities (CS) are both used here, but at different timescales.
If we immediately doubled CO2 from some stable baseline, for the short-term warming over the next few decades (accounting for the climate lag) the transient climate sensitivity (2°C per 2xCO2) would be most appropriate, as it accounts for the direct radiative forcing caused by greenhouse gases (about 1°C) and the fast amplifying feedbacks (like water vapour, providing the other 1°C). On timescales of more like a century or more, the equilibrium climate sensitivity (3°C per 2xCO2) is more appropriate to use, as it includes the slower feedbacks that gradually add another 1°C. On timescales of millennia or more the climate sensitivity is even more (as it accounts for big slow shifts in ocean circulation and big ice sheets), but that’s beyond our current predicament.
For the quoted calculation example, I’m using the current radiative forcing anomaly humans are causing (as of the last IPCC report) of +2.3 watts per square metre, and projecting forward what warming that would cause (and assuming no further emissions). As above, for the next few decades we’d use the transient CS, which gives us about 1.2°C (about 0.2°C more than warming at that point, so a little bit of catch-up to do). For about a century’s time the equilibrium CS is more useful, which gives us 1.8°C, and for the decades in between we’d expect a gradual ramping up from 1.2 to 1.8°C.
So, to return to your question, it’s not so much that there’s a new higher equilibrium climate sensitivity value that should be used instead of the lower transient one, but that they should be used according to what timescale you want to estimate the warming for. Going from the last IPCC report numbers and with no further emissions, we would still expect ~1.2°C after a decade or so, and ~1.8°C within a century or so.
The ¨1.5°C in around two decades time estimate later on is based on a simple extrapolation of the observed current trend of about ~0.2°C warming per decade, so adding 0.4°C onto our current 1.0-1.1°C. This warming-per-decade trend incorporates various factors such as the climate lag (i.e. it’s mostly driven by emissions a couple of decades old) and timescale-dependent sensitivity (i.e. it’s mostly short-term transient warming with a little bit of long-term feedbacks on earlier warming), and is consistent enough to be expected to keep going (but with some decades a bit higher or lower). The important question here regarding lags and sensitivities is more on how long this trend will carry on for, as both the lag and equilibrium CS show that warming has a long drawn-out tail.
Of course, there’s still wider discussion on the exact value of climate sensitivity – most exisiting models, palaeo studies, and observations support an ECS range of 1,5-4.5°C with 3°C most likely, but new models seem to be running a bit hotter. But for consistency I’ve used the gold standard 3°C ECS until further notice!
Hope that helps clarify it a bit more!
LikeLike
Sorry, just wanna make sure I have this correct: even if the ECS is above 3°C (like you say some new models predict) that doesn’t change your predictions for when we hit 2°C because ECS is more for longer periods of time like centuries? So with lag and whatnot that higher ECS affects things later on in the century?
LikeLike
Yeah, the possibility of a higher climate sensitivity mostly applies to the longer-term ECS when discussed in modelling, with most of the CS uncertainty applying to the longer-term feedbacks that boost TCS to ECS on multi-decadal timescales (so when climate scientists are currently discussing/debating higher CS in the new CMIP6 models they’re talking about ECS rather than TCS). It might still affect my projections a little bit though as some of the 2020s warming will be from longer-term feedbacks from early-on emissions, but as short-term warming from the last few decades of emissions will be dominate the TCS is mostly fine. Most of the time people don’t really bother comparing model TCS as short-term temperature increases just emerge from the models, but as this fact-check was focusing on claims of runaway warming by 2030 and had to use non-modelled emission estimates it was the more relevant one to use. To be fair though I’m not actually sure what the TCS is relative to the ECS on the new CMIP6 models as details of the completed models are yet to be fully released, so I’ll keep my eyes on that!
LikeLike
Hello Dr. McKay,
I wanted to be sure I understood your segment on ECS and TCS correctly: as I understand it, Co2 equivalent gas levels are around 500 ppm or so, but I see most measures for Co2 doubling reliant on the current ~410 ppm of Co2, measured against the 560 ppm we’d have to reach to get to a doubling of Co2. Is the Co2 measure itself more important here, or do the equivalent gases matter just as much when we’re talking about a doubling of Co2?
Also, in your comment to Arthur on the fifth, I was curious whether you are talking about an additional 1.2/1.8 degrees C of warming on top of what we’d otherwise experience, or whether we would reach that total amount of warming by then?
“For the quoted calculation example, I’m using the current radiative forcing anomaly humans are causing (as of the last IPCC report) of +2.3 watts per square metre, and projecting forward what warming that would cause (and assuming no further emissions). As above, for the next few decades we’d use the transient CS, which gives us about 1.2°C (about 0.2°C more than warming at that point, so a little bit of catch-up to do). For about a century’s time the equilibrium CS is more useful, which gives us 1.8°C, and for the decades in between we’d expect a gradual ramping up from 1.2 to 1.8°C.
So, to return to your question, it’s not so much that there’s a new higher equilibrium climate sensitivity value that should be used instead of the lower transient one, but that they should be used according to what timescale you want to estimate the warming for. Going from the last IPCC report numbers and with no further emissions, we would still expect ~1.2°C after a decade or so, and ~1.8°C within a century or so.”
LikeLike
Hey Mitch, apologies for the delayed response (been on holiday and then travelling for work).
So you’re right in that for a fuller climate sensitivity analysis we’d want to use warming per doubling of CO2 equivalent (CO2e), which as of 2016 was about ~450ppm (https://www.eea.europa.eu/data-and-maps/indicators/atmospheric-greenhouse-gas-concentrations-6/assessment). I didn’t use CO2e in the posts in order to keep things a bit simpler (CO2e takes a little more explaining and isn’t quite as well tracked over long timescales), but it would have the effect of slightly reducing most of my warming estimates (as for say a 20ppm CO2e increase, 20/450ppm would yield a smaller fractional increase than 20/410ppm) – this means that in some ways my estimates are on the liberal side, which is useful in assessing these big claims by giving them the benefit of the doubt but still finding them overstating things.
For the second question, those are estimates of the total cumulative warming we’d reach and not additional warming on what we’ve already had – at the time of the forcing estimate we were at 1 degrees cumulative (vs. 1850-1900 baseline), so this rough calculation would suggest if this radiative forcing was held exactly steady temperatures would go up another 0.2 degrees over the next multiple decades through to 2100 (to 1.2 degrees), and slowly creep up by another 0.4-0.6 degrees (towards 1.6-1.8 degrees) over the following few centuries (BUT other factors like longterm carbon sinks would start to counteract this – see post clarification).
LikeLike
Ah, good to know! Thank you for the clarification (and no worries on the delay, we’re all busy nowadays).
LikeLike
Dr. McKay, why do your numbers differ so dramatically from the findings of the IPCC, particularly the latest SR15 report? In figure 1.5, (chapter 1, page 65), several scenarios of the immediate cessation of CO2, aerosols and non-CO2 GHG emissions are considered. Even in the highest temperature-rise scenario, where CO2 and aerosol emissions cease immediately but non-CO2 GHG emissions continue unabated, the IPCC projects +0.5C of warming by 2100. In scenarios where all GHG emissions are ceased, temperatures will actually fall below 2020 levels by 2100, about -0.1-0.4C depending on whether aerosol emissions are ceased as well or not. This is in stark contrast to your assessment, where an immediate cessation of carbon emissions, (presumably including methane, a carbon molecule), and aerosols would result in a rise of at least +1.3C by 2100. What is the source of this discrepancy?
LikeLike
Hi Alex, thanks for your question. I’d just been thinking about this, having recently read a Twitter discussion linked to this, and it reminded me I need to clarify that my calculations here are for a constant concentration scenario (i.e. fixing current ghg/aerosol concentrations – with no subsequent drawdown – and letting the temperature reach equilibrium with the resultant constant forcing), which is slightly different to what I appear to imply in that section. For a full cessation of all ghg/aerosol emissions, the IPCC SR1p5 scenarios are indeed the best estimates. I will update this section soon with to clarify what my calculations are for and how they relate to SR1p5, but I’m currently travelling on my way to an off-grid holiday so may not get a chance for a little while yet.
LikeLike
Hi David, I was wondering if this new report on the Amazon becoming a carbon source within the next few decades changes what you said about the Amazon causing at most 0.15 degrees of warming by 2100? https://www.theguardian.com/environment/2020/mar/04/tropical-forests-losing-their-ability-to-absorb-carbon-study-finds
Also thank you for these great posts, it’s great to find information which tells us what the science says!
LikeLike
Hi Alex, here’s my thoughts on the new study – in short, the Amazon carbon sink starting to shrink and the savannah tipping point are somewhat different issues, and the former process will have less of an impact on global CO2 emissions than the latter: https://twitter.com/ClimateTipPoint/status/1236948180593446912
LikeLike
Thank you David for this – it’s a massive help. I also hope I could possibly ask about the 0.2 per decade warming trend? I found this https://www.nature.com/articles/d41586-018-07586-5 saying that we could pass these temperatures sooner than expected, and have seen other sources which would suggest warming is greater than the 0.2 per decade – any clarity you can offer to a layman such as myself!? Sorry for the bombardment of questions! thanks
LikeLike
Yes, approx. 0.2C is the current mean decadal warming trend for the last few decades, but it’s a) gradually speeding up as emissions are growing too, and b) subject to large natural variability. That article is right in terms of pointing that out, but I think slightly misrepresents the IPCC SR position – the IPCC had a fair bit of uncertainty on their projection which isn’t shown in this article’s plot, and although it doesn’t fully overlap with the model projections plotted it still did include 1.5C at 2030 as entirely possible. Natural variability will also eventually go both ways – we’re currently on a faster than average decade, following the slower than average decade that led to claims of a global warming “pause” – so although it might help us get to 1.5C sooner it’s not quite right to paint that as a shift in the long-term trend, as the opposite will eventually follow (or another part of the climate system’s natural variability may counter it for a time). Effectively this paper is making the case that 1.5C will be hit at the early end of the IPCC’s range, so still fits within that wider IPCC framing. Indeed, that early-1.5C-2030 date forms part of the basis for the 10 years until 1.5C narrative that people took from that report, so people are already correctly taking the precautionary approach by focusing on the early date. But yes, I think the mean decadal warming rate ramping up to 0.25-0.3C is likely if emissions continue to grow, but with the strong caveat that any decade in particular could be quite a bit above or below.
LikeLike
Thank you very much for taking the time to reply, that explains it really well!
LikeLike
Hello Dr. Mckay, it’s nice to see some logic behind those numbers, because sadly there are some individuals who like to promote weird scenarios with warming of ~5ºC or even~10ºC in a decade, which are ridiculously inconsistent with the best available peer-reviewed science and scientific estimates. However, I noticed that most (realistic) scenarios and estimates are based assuming an ECS of ~3ºC, and I was wondering how your estimates in this post would be affected if ECS turned out to be higher, say ~3.5ºC or 4ºC. I know you already talked a bit about TCS and ECS above in the comments, but I still fail to understand how all of this works (unfortunately science is not my thing).
I thought about this because I noticed that some palaeo data from warm periods tended to show ECS around ~4ºC, and it is argued that warm periods like the paleocene (I think) usually have higher sensitivity than colder ones (on a side note, are interglacial periods like ours considered to be “warm” periods? Therefore, would we expect to have a similar sensitivity to those similar warm periods?) I know there are other lines of evidence, but I’m somehow concerned about other lines of evidence being biased too low and thus the real ECS value to be closer to the high end of the range instead of the consensus ~3ºC (obervations I think show an ECS of ~2ºC, which is pretty low, and palaeo in general tends to show higher values. Some proxies about glacial periods also are said to be biased a bit low, but the consensus is still at ~3ºC, and I still struggle to understand how all evidence is reconciled!)
Most scientists say a higher ECS would make warming to come faster, around a decade or so, but I still don’t know how all of this would affect our current emissions trajectory (which is most likely between RCP4.5 and RCP6.0) plus the feedbacks and tipping points, and how much warming we would expect by the end of the century.
Thanks for reading, and sorry for the long comment!
LikeLike
Hi Natalie, apologies for the delayed reply, this ended up in the spam folder for some reason!
Yes it’s true that ECS could well be a bit higher than 3C. The last IPCC report had the likely range as 1.5-4.5C, and based on model constraints and the palaeo evidence you mention I personally think 3-4C is the mostly likely ballpark. Observations do tend to come out a bit lower, but the trouble is that ECS refers to what happens over centuries, which makes extrapolating from only a few decades of data more difficult. Even on short timescales though this data suggests the shorter-timescale sensitivity (Transient Climate Response, TCR) is around 1.5-2C, and given that on balance we’d expect extra net-positive feedbacks in the longer term I think anything below ~2 is rather unlikely for ECS. Some recent model revisions (CMIP6) have much higher ECS (~5C), but models with ECS that high don’t tend to match historical observations so well, suggesting they may be overdoing it. There’s also the potential for some state-dependence to as you say, with ECS varying a bit depending on the initial temperature (although it’s possibly the other way round, with icy times maybe having higher ECS as things like polar sea ice loss can amplify changes more – this is still an active research area though).
Re. our current trajectory, current trends/policies suggest ~3C by 2100, but high sensitivity due to strong feedbacks could push this up to ~4C (but is less likely). Precautionary principle means we should take this low-probability high-impact outcome more seriously than the counter-case of low sensitivity though, and accordingly cut GHG emissions ASAP. As for my estimates in my posts, most of the time I’ve worked out warming on decadal timescales using a TCR of 2C (which is actually a bit high, for simplicity and to give estimates the benefit of the doubt). Where I give a longer timescale warming I’m using an ECS of 3C, so to estimate the impact of an ECS of 4C one can multiply the warming I give by 4/3. In this particular post though as the original claim was for decadal-timescale abrupt warming I think all of the estimates I give are based on short-timescale TCR.
LikeLike
Thank you so much for the reply, and don’t worry about the delayed response! Your explanation is more or less what I guessed. Recently I read some discussions from climate scientists about how we can’t really rule out an ECS of ~5ºC, but also how there is little evidence to support the likely ECS being higher than we thought. Those discussions & your blog are really helping me understand the science better!
Oh, and I’m looking forward to see more of your posts!
LikeLike
Hello, sorry for bothering you again – a new study about carbon loss from tropical forests has just come out, and although carbon release from soils is a feedback rather than a tipping point, I wanted to know your thoughts on this. The study itself is here: https://www.nature.com/articles/s41586-020-2566-4 , and I found some additional details here: https://www.nytimes.com/2020/08/12/climate/tropical-soils-climate-change.html .
The NY Times article says “If the entire tropics were to behave similarly, the researchers estimate that 65 billion metric tons of carbon would enter the atmosphere by 2100 — more than six times the annual emissions from all human-related sources” . This, as far as I understand in relation to the study, would mean that once tropical soils warm up 4ºC for about two years (which could happen if global temperature increases ~3ºC, since soils warm up more than the global average) they would realease 65 billion metric tons of carbon (or at least that’s what I understood).
While there are some caveats mentioned in the NY Times article, such as the fact that researchers measured carbon release in a very specific fertile place, I was wondering how the release of carbon from tropical soils (alongside carbon released from more temperate soils) might affect warming predictions by the end of the century. Especially I wondered how much warming this estimate (65 billion metric tonnes) would add by 2100, assuming the estimations are right. Would it be a catastrophic warming increase, comparable to those of some exaggerated claims? (meaning 1-2ºC on top of projected warming).
Again, thanks in advance, your explanations are really useful to understand climate science!
LikeLike
Hi Natalie, yes this is an interesting study! A few caveats though: 65bn tonnes is about 6 years worth of current emissions, which is a fair bit and definitely unwelcome but spread over the rest of the century would still be a lot smaller than human emissions. If released in full and assuming no reabsorption (currently ~50% of human CO2 goes back into natural carbon sinks) it would amount to ~31ppm of CO2, which using current CO2 and a standard climate sensitivity would yield about ~0.2C warming – so again unwelcome but not catastrophic even in the worst-case. There are other caveats too though: extrapolating from one site to the whole biome is always tricky and liable to overestimates, and this study only warmed up the soil and not the plants too (warmer plants and higher CO2 likely increase plant productivity and therefore organic carbon input back to the soil, assuming there’s enough water and nutrients around too). So I’d expect 65bn tonnes to be a worst-case high estimate, and the real number taking into account other factors likely somewhat lower. Ecosystem feedbacks get pretty complicated though, so there’s a lot of uncertainty on this stuff!
LikeLike
Again, thank you so much for your answer! I guess I got a bit confused by the press coverage. It’s always interesting to hear your thoughts on recent studies!
LikeLike