
Claim: Global dimming (due to cooling by aerosols, as opposed to warming from greenhouse gases) is masking a large amount of warming (0.7-1.5°C), so if we started to reduce carbon emissions now we’d get a paradoxical catastrophic jump in global warming instead.
Reality: Global dimming is masking around 0.6-0.9°C of anthropogenic warming, but shutting down the worst carbon emitters (like coal power stations) now would not lead to all aerosols disappearing immediately or a sudden, dramatic warming. A gradual phase-out of aerosol as well as methane and N2O emissions would minimise extra warming.
This is the second post in a new climatetippingpoints.info series fact-checking claims that various climate tipping points have been crossed, and that sudden catastrophic warming is now inevitable. See the Introduction post for an overview.
It has been claimed that if humans reduced carbon emissions now we’d actually end up causing a rapid jump in warming (by 0.7oC or even 2.5oC in less than a year) as a result of something called global dimming. This has been posed as an unavoidable paradox, as by closing high emitters like coal-fired power stations in order to reduce greenhouse gas emissions we’d end up increasing temperatures anyway through global dimming, potentially passing dangerous climate tipping points.
In this post of climatetippingpoint.info‘s new Fact-Check series, we investigate how much warming global dimming is shielding us from, and if this means we’re trapped in to keeping carbon emissions going.
Removing the Mask
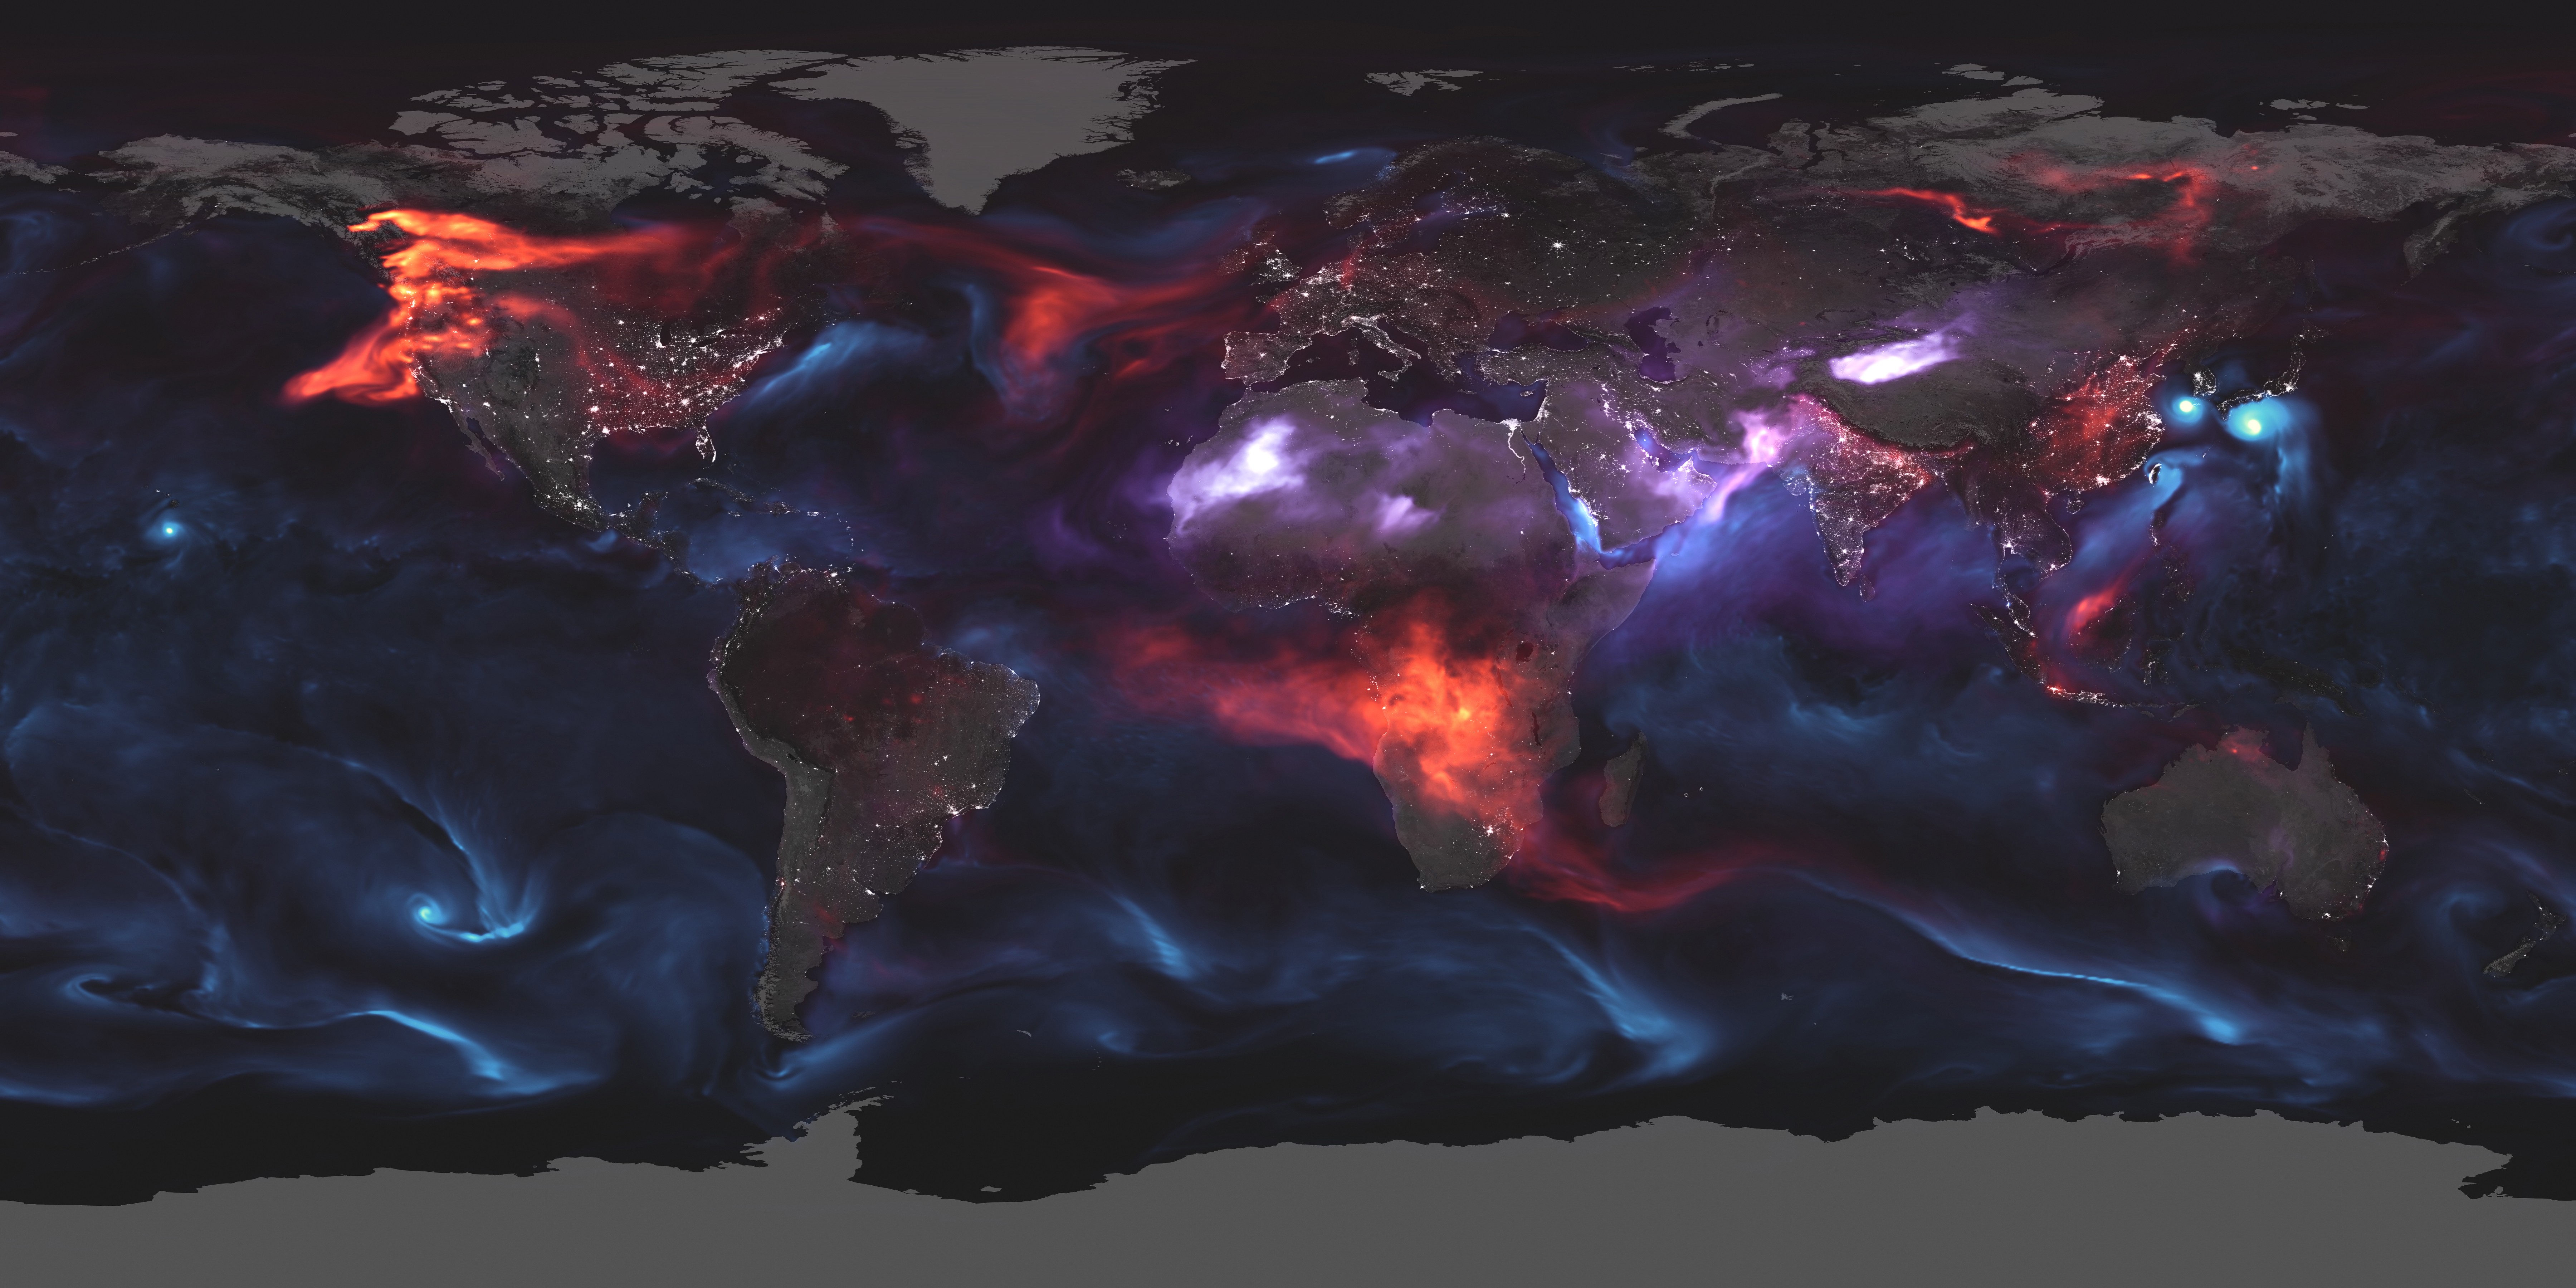
Global dimming is the opposite of global warming, with tiny particles we emit called aerosols scattering away incoming solar energy and so cause cooling (as opposed to greenhouse gases, which trap heat and cause warming). They also affect cloud formation, impacting on how much heat those clouds either trap or reflect. Human aerosol sources include sulphate from burning fossil fuels like coal, soot from factories or wood-burning, and dust from roads and land degradation. Natural sources of aerosols include deserts, trees, sea salt, and volcanoes.

Before clean air laws were introduced in the 1970s and 1980s, aerosols may have balanced out warming from carbon emissions and contributed to relatively stable temperatures in the 1950s to 1980s, but this effect has been declining since the 1990s. It’s also been suggested that there was a 1oC warming jump in the days following the September 11th attacks when aeroplanes in the US were grounded for a few days, and that this implies a large amount of warming is masked by planes alone.
In recent decades though greenhouse gas emissions have continued to grow while aerosol emissions have declined (as clean air laws have kicked in), and so overall we have net global warming. The graph below shows all of the factors driving global warming and cooling (in terms of global Radiative Forcing (RF), the actual human-driven energy imbalance that leads to temperature change, measured in Watts per square metre of Earth’s surface), leading to the overall warming effect summed up at the bottom:
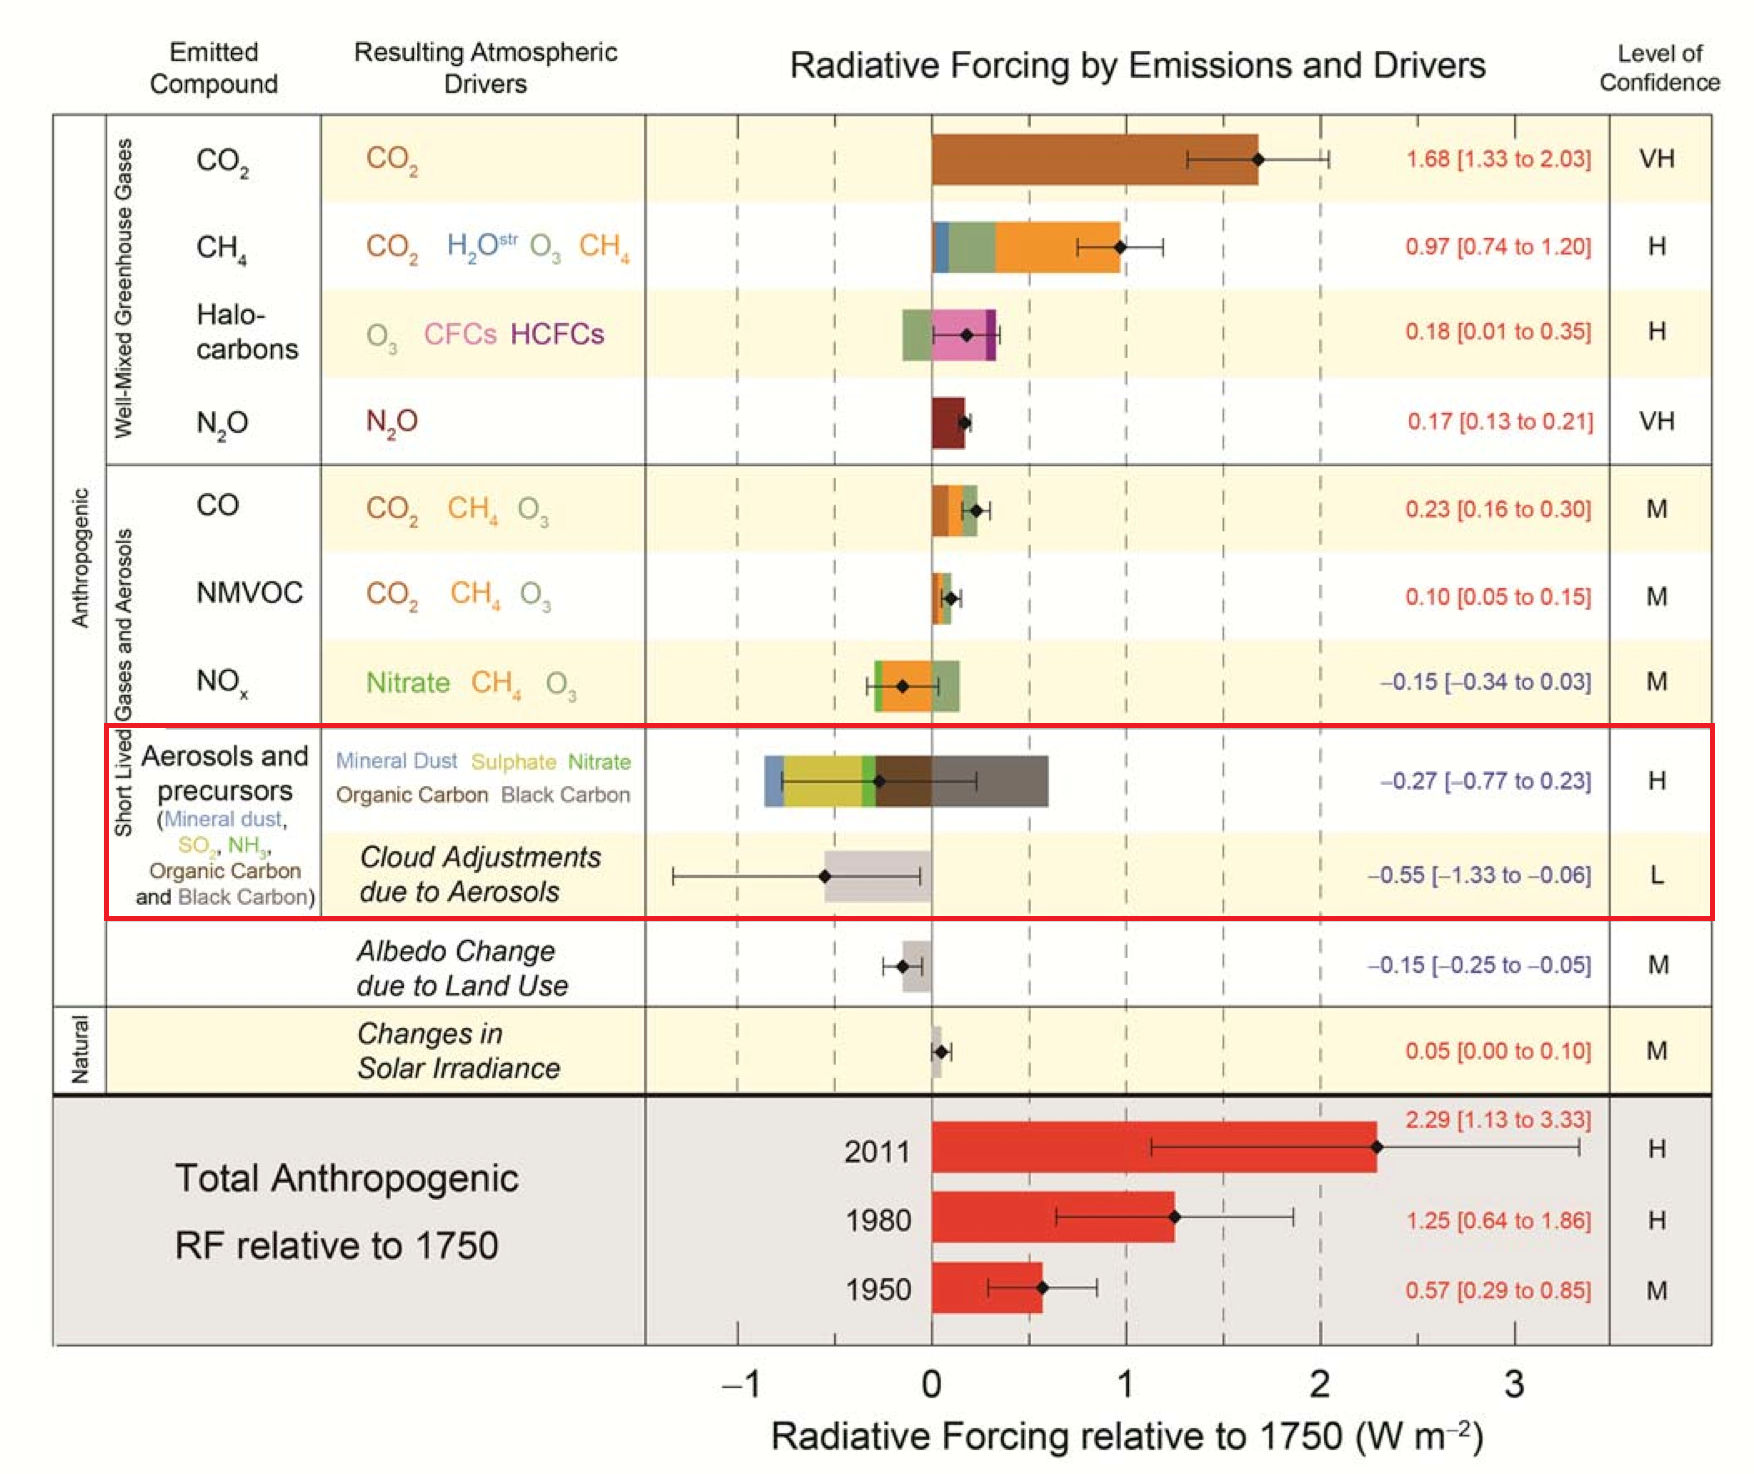
You can see from the graph above that despite the far larger greenhouse forcing, there’s still a fair bit of global warming being masked by aerosols. Doing the sums from these figures, the overall combined effect of aerosols (including indirect cloud effects) on RF in 2011 was around -0.8 W/m², which if totally removed (and without accounting for extra feedbacks, which we tackle in other posts) would be equivalent to up to +~0.4oC within a decade or so and +0.6-0.8oC within a century. This also fits with the sources of the observed warming so far (with a net non-greenhouse gas forcing of around -0.25oC for 1950-2010, versus -0.34oC for the same gases now on the graph above). As it’s RF changing rather than temperature, as with CO2-driven warming there’s a lag before global temperature catches up, a bit like how an oven takes a while to heat up even if you turn the heat right up.
Some recent studies have also suggested that the indirect cloud effects might be towards the larger end of the IPCC AR5 range at around -1 W/m² or more (boosting the total aerosol effect to ~-1.3 W/m² / ~0.7-1.1oC), or that aerosols have double the impact of cooling by low-level marine clouds. Higher indirect cloud effects would mean that the amount of warming being hidden by aerosols may be larger than we currently think, and therefore the climate system may be far more sensitive to greenhouse gases than we feared. However, the cloud dynamics associated with aerosols remain highly uncertain, and the latter study also suggests that aerosols could have counteracting warming effects on other higher-up clouds as well. A more recent and thorough study used multiple new CMIP6 models and observations to constrain the total aerosol RF to about -0.9 W/m² (0.5-0.9oC) in 2019 (with -0.6 W/m² from indirect cloud effects), close to the IPCC’s estimate of -0.8 W/m² in 2011 and supporting climate sensitivities around what we expected.
We can also look at a natural case-study of the impacts of a rapid change in atmospheric aerosol content: the Mount Pinatubo eruption in 1991. This eruption injected huge amounts of sulphate aerosols into the stratosphere, and led to a global cooling of ~0.5oC peaking within 1-2 years before the sulphate aerosols began to decay. In effect, this is the reverse of our scenario of a shutdown in anthropogenic aerosol emissions, with aerosols rapidly added rather than removed. However, the peak global RF change was a very large ~-3.5 W/m², which if it were sustained over a decade or so would have led to an even greater cooling of ~1.9oC (and ~3.8oC over a century). This shows how a rapid change in global RF from aerosols still takes a while to drive a change in global surface temperatures, with only ~20% of the total potential impact occurring within a year and ~60% in around 10 years. It’s important to note that this is the global RF and temperature change — a drop in localised aerosol emissions would have a much more rapid regional impact with noticeable effects within only weeks, but it’d take much longer for the whole of the global climate system to catch up.

Image credit: Dave Harlow, public domain image from the United States Geological Survey.
So the +0.7oC quoted at the start of this article is close to our estimate here of an eventual warming of ~0.6-0.9oC over a century, and fits with other studies too. However, larger masking effects are sometimes claimed. One model study has projected up to 1oC warming resulting from ~80% aerosol emission cuts [NB – this study is often misrepresented as saying this is from as little as a 35% cut, but this figure is only for organic carbon emissions which have a smaller effect], but this represents what would be masked by 2100 after continued moderate CO2 emissions rather than what is being masked right now. An even higher figure of 2.5oC is also sometimes claimed, but this is hard to reconcile with observed RFs and heat budgets. This figure is also based on just one model, with an estimate for the strength of aerosol-cloud feedbacks far outside the range of other models and observations. If aerosols are confirmed to have a larger indirect effect on clouds though then their total effect over a century could be closer to ~1oC, but this has not been convincingly proven.
Shutting Down Debate
The big difference between aerosols and greenhouse gases though, is that aerosols have a very short lifespan in the atmosphere, falling out of the atmosphere after only a few weeks. This has led to the fear that shutting down heavy carbon emitters like coal power stations as part of decarbonisation would lead to a rapid warming spike as all the aerosols disappear, risking passing imminent climate tipping points. This scenario is sometimes called the dimming paradox, or the “McPherson Paradox” after one well-known and controversial proponent.
But human-made aerosols have many sources, from power plants to cars, fires, and agriculture. An immediate removal of all human-made aerosols over only a few years is extremely unlikely, with decarbonisation likely taking decades. It’s also worth remembering that some aerosols, such as black carbon (soot from incomplete burning) in smog and “brown clouds“, actually cause warming as well (by absorbing some incoming solar energy rather than scattering it), and so driving down aerosol emissions from industrial smog would reduce a source of warming as well as cooling. And as discussed in the last section, while a drop in aerosol emissions would have a rapid regional effect it’d need to be sustained for years for the whole global climate system to respond. This was illustrated by the coronavirus shutdown – while some feared the ~17% drop in CO2 (and therefore similar for aerosols) emissions in April 2020 would lead to a catastrophic warming spike by November, emissions later rebounded and 2020 ended up being only marginally warmer than 2019. Subsequent modelling showed that although aerosol masking dropped by up to ~0.3 W/m² during 2020 this will only lead to a temporary warming boost of 0.1-0.3oC regionally and 0.03oC globally.
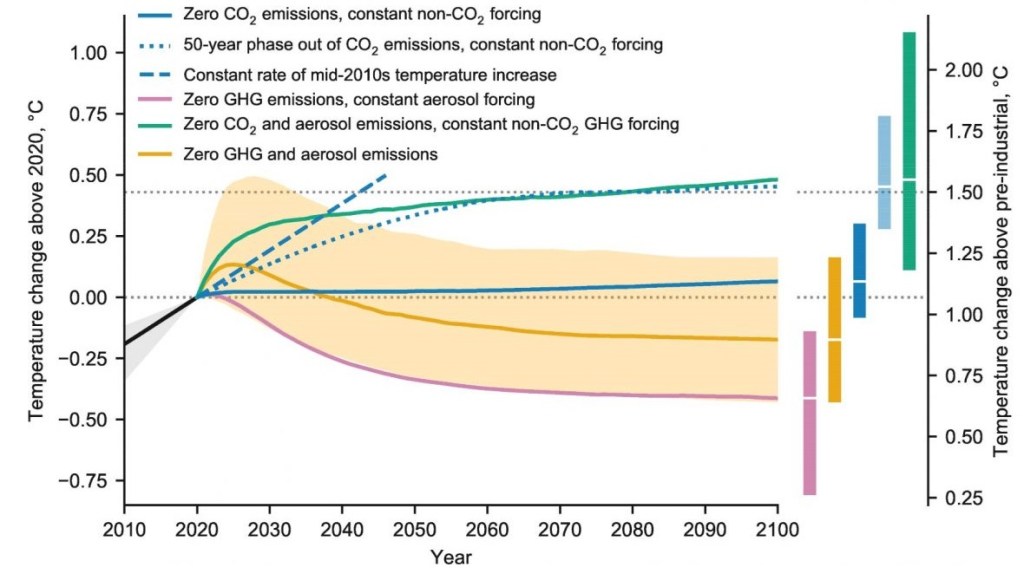
As a result, any warming from aerosol reduction would be more gradual and partial than portrayed in the dimming paradox scenario. The most recent IPCC models (CMIP6) project aerosol RF to fall to levels last seen in the early 20th Century (from 0.9 to ~0.35 W/m²) by 2100, a significant but by no means sudden reduction. Even if an immediate phase-out of aerosols along with CO2 happened, more realistic modelling for the 2018 IPCC Special Report on 1.5oC showed that the actual aerosol warming bump would be at most a temporary ~0.2oC warming after a decade (the green-vs-dotted blue curves below, while the yellow-vs-pink curve isolates the aerosol effect, giving ~0.15oC after a few years and ~0.25oC by 2100), which is equivalent to a about a decade’s worth of the current global warming trend. This is less than the ~0.4-0.8oC calculated above, as this modelling takes account of the Earth system feedbacks that in this case reduce the impact of aerosol reductions. A controlled phase-out of aerosol emissions alongside equally short-lived but strongly-warming methane and N2O (shown by the yellow curve below) would help limit the immediate warming impacts and reduce the risk of hitting any climate tipping points in the process.
And what about the often-mentioned temperature jump in the US after September 11th, 2001? This was likely more to do with the impact of the disappearance in contrail clouds (the thin strips of cloud left behind by planes) on the temperature difference between night and day (with warmer days and cooler nights), with no evidence for an overall warming effect. It also represents an aerosol-cloud effect that is specific to aeroplanes, and wouldn’t apply in the same way to shutting down power stations. And while it’s true that a sudden drop in other aerosols would have a rapid effect locally (with the days feeling warmer as more solar radiation makes it through), as mentioned above it would still take a widespread shutdown over several years to build up a significant effect on global average temperatures.
Finally, a key problem with avoiding limiting aerosol emissions by keeping heavy polluters going is that further carbon emissions guarantees further warming anyway, even if part of it continues to be hidden by aerosols. Overall it’s probably worth experiencing a decade’s worth of global warming from reduced aerosols now instead of inexorably building up ever more decades of warming from continued carbon emissions in the future.
Summary
While the total removal of human-made aerosols theoretically leads to a short-term warming of up to ~0.4oC (and ~0.6-0.8oC by 2100), an abrupt end to all aerosol emissions (but not methane or N2O emissions) at once is very unlikely, and other feedbacks would reduce this warming bump too. Decarbonisation will take decades, and aerosols come from a wide variety of sources beyond just the heaviest emitting power stations. IPCC modelling projects that even a rapid phase out of aerosol emissions would lead to a temporary ~0.2oC of warming – the equivalent of around a decade more of the current warming trend – which is preferable to carrying on emitting carbon indefinitely, and can be partly avoided by also reducing emissions of short-lived greenhouse gases like methane and N2O.
~
This post was written by Dr. David A. McKay, currently a Postdoctoral Researcher at Stockholm Resilience Centre (Stockholm University), where he is part of the Earth Resilience in the Anthropocene Project (funded by the European Research Council) and is researching non-linear climate-biosphere feedbacks. This post was written in his spare time with no funding support for this site, and was proofread and edited by Dr. Rachael Avery.
Update Log: 14/1/20 Details of IPCC SR1.5 modelling of the impact of immediate aerosol emission cessation added, along with studies suggesting indirect cloud effects towards the higher end of the IPCC range; 17/3/20 discussion of Mt. Pinatubo as a natural case-study of aerosols triggering global temperature changes over a few years; 14/4/20 links to other studies estimating the total aerosol temperature masking magnitude (~0.7C), subheading links, and a clarification on short-term effects added; 8/1/21 extra links to address comments by Guy McPherson, adding covid shutdown example, and using a slightly higher ECS for aerosols than CO2; 16/6/21 with new CMIP6 aerosol RF study supporting IPCC AR5 RF range, modelling showing minimal warming resulting from the 2020 covid shutdown, and more discussion of compensatory CH4/NOx reductions.

Thank you so much for this!! I’ve been so concerned due to the messages of people like Guy McFEARson and to have such a detailed rebuttal to his claims is much appreciated, as it had been messing with my anxiety something fierce
LikeLiked by 1 person
No problem, glad to be of help!
LikeLike
Did you write this article?
LikeLike
I did indeed – full credits are at the bottom of the post. In general posts on climatetippingpoints.info are written by me (Dr. David A. McKay), and proofread & edited by Dr. Rachael Avery.
LikeLike
Thank you so much for putting things into their proper balance, leaving my mind less confused about what is inevitable and what isn’t.
LikeLike
No problem, glad it was helpful!
LikeLike
Ignorance is bliss. And hope is debilitating. That’s why McKay has it wrong, and he will know by November this year.
LikeLike
Thanks for the fan mail, I’ll take it as a complement 😉
I assume this is linked to Guy McPherson’s claim that the coronavirus-induced slowdown in emissions will cause a rapid collapse of aerosol dimming and so trigger a massive temperature jump this year and therefore rapid runaway warming all the way to human extinction (e.g. https://opastonline.com/wp-content/uploads/2020/04/will-covid-19-trigger-extinction-of-all-life-on-earth-eesrr-20-.pdf). As you might expect though, I think there are a number of flaws in this thesis. Firstly, it requires a rather large total magnitude for the global dimming effect – in his blog/article he cites Levy et al 2013 (https://doi.org/10.1002/jgrd.50192) to say that a 35% aerosol emission cut leads to ~1C of rapid warming (which Guy then drops to 20% for unspecified reasons), but as noted in my post 1C represents what’s masked in just this particular model *by 2100* after continued CO2 emissions rather than what is being masked *now*, and 35% is the *minimum* drop needed of a range going up to 80%. As discussed in the post I think the current total masking effect is likely to be ~0.6C long-term (& maybe up to 1C with high indirect effects), but it’d take months-to-years to see even 0.4C (as was the case with the opposite scenario of Pinatubo). Guy also assumes a sustained 20-35% drop-off in industrial activity (based on China’s temporary 25% drop in CO2 emissions and globally 17% in April), but given that China’s coal burning is already back up (https://www.carbonbrief.org/analysis-coronavirus-has-temporarily-reduced-chinas-co2-emissions-by-a-quarter) and total CO2 emissions are projected to fall only 4-7% over the whole year (https://www.nature.com/articles/s41558-020-0797-x) it seems clear this drop is not being sustained. If a massive warming spike were to happen within weeks in response to this Spring’s emission drop then it would’ve clearly happened already, and if the warming takes months and/or is smaller than claimed then the ongoing rebound of emissions would serve to re-mask most of it by November.
So I think I fancy my chances of being proved right by November, and that I’m not just huffing the hopium. We could even take a little wager – if I’m right, I can pour myself a congratulatory drink and you can pour yourself a commiseratory drink at Christmas, and if I’m wrong and we’re not both dead (presumably you live on the same planet and so this affects you too?) then we can swap drinks!
LikeLike
So, where was your rapid global warming?
LikeLike
“As it’s RF changing rather than temperature, as with CO2-driven warming there’d be a bit of lag before temperature catches up”. It’s 2,000 years bit of lag before temperature catches up if you’re interested in 99% catching up. Of course, if you’re only interested in ~100 years then there’s still 40% of temperature catching up after that eye blink of time (though Jim Hansen claims <=25%).
LikeLike
Yes indeed, it takes a very long time for the full signal to emerge – if it were plotted on a graph it’d be something like a log function, with a faster initial response but slowing down to a crawl over time. But the decadal timescale of climate mitigation scenarios is the most relevant for the claim being addressed here (that cutting CO2 emissions will also happen to lead to warming jumps within only a few years), even if it’s good to keep long Earth system timescales in mind too.
LikeLike
“if it were plotted on a graph it’d be something like a log function”. I’ve seen that plot, the “surface climate response”, output from climate models,
at 4:34 to 5:30 at https://www.youtube.com/watch?v=WadywyVi7xM&t=2537s
and
at 9:59 at https://www.youtube.com/watch?v=JP-cRqCQRc8
LikeLike
Yep, they show it nicely! In general in these posts I’ve been focusing on either the near-term decades or by 2100 as that’s what most of the online discourse on tipping points/feedbacks focus on, but I also support taking a long geological view on things to remember that climate change will keep on going for millennia to come, which is all the more reason to reduce emissions ASAP.
LikeLike
dvdmckay “in his blog/article he cites Levy et al 2013 (https://doi.org/10.1002/jgrd.50192) to say that a 35% aerosol emission cut leads to ~1C of rapid warming (which Guy then drops to 20% for unspecified reasons), but as noted in my post 1C represents what’s masked in just this particular model *by 2100* after continued CO2 emissions rather than what is being masked *now*, and 35% is the *minimum* drop needed of a range going up to 80%”.
—–
Oh you got that very incorrect David. McPherson lied much worse than you just indicated. There is no range at all in the Levy et al. It’s specific amounts. Obviously, McPherson didn’t read the Levy paper and it appears that you didn’t either, but I did. Here it is, cut’n’paste of my standard comment about that McPherson lie:
—–
** Item 1 of 2 McPherson lies/exaggerations ** Rigorous, easily verifiable, analysis of an egregious lie by Guy McPherson (a huge exaggeration of 2.3x the actual warming effect) at https://guymcpherson.com/2019/08/a-concise-overview/ on a very important topic. The Guy McPherson lie being fact-checked here and failing miserably is: “the conclusion by Levy et al. (2013) indicating as little as 35% reduction in industrial activity drives a 1 C global-average rise in temperature”.
————–
The “35% reduction” is a huge exaggeration lie because the paper has an 80% reduction of sulphate (SO2) emissions, not 35%.
————–
In Figure 1 at the bottom of page 4523 of the paper “The roles of aerosol direct and indirect effects in past and future climate change” of Hiram Levy II, Larry W. Horowitz, M. Daniel Schwarzkopf, Yi Ming, Jean-Christophe Golaz, Vaishali Naik, and V. Ramaswamy accepted January 16, published May 20, 2013 you see the plot showing an 80% reduction in SO2 emissions by 2100 AD, from 116 megatonnes of sulphates / year at 2005 AD down to 23 megatonnes / year at 2100 AD, so the reduction in SO2 emissions is 80% not 35% and this is McPherson’s huge lie, an exaggeration by a factor of 2.3x (80%/35%) the actual effect.
————–
Nowhere in the paper that McPherson falsely claims to reference is a 35% reduction in SO2 emissions used. In fact the reductions aren’t just some kind of random examples, they are specifically the calculated reductions by 2100 AD by following IPCC scenario RCP 4.5 for CO2 emissions this century and they are ==exactly== by 2100 AD (so reducing throughout that time):
– an 80% reduction in sulphate (SO2) emissions, and
– a 50% reduction in black carbon (BC) emissions, and
– a 35% reduction in organic carbon (OC) emissions.
Exact quote from Levy et al paper: “By 2100, RCP4.5 projects an 80% reduction in SO2 emissions, a 50% reduction in BC emissions, and a 35% reduction in OC emissions [Lamarque et al., 2011]”.
Here’s the warming shown in Table 1 in the paper for each of those 3 reductions:
– 1.05 W/m**2 for the 80% reduction in sulphate (SO2) emissions, and
– -0.05 W/m**2 (A COOLING) for the 50% reduction in black carbon (BC) emissions, and
– 0.25 W/m**2 for the 35% reduction in organic carbon (OC) emissions.
– 1.26 W/m**2 for the aerosol-cloud effects of all 3 (which will mostly by far be the 80% reduction in sulphate (SO2) emissions because black carbon makes clouds blacker, not more reflective, and organic carbon is also dark).
As clearly seen above it is the sulphate (SO2) emissions that are having by far the largest “global dimming” effect of the 3 types of pollutants listed and the sulphate (SO2) emissions are reduced by 80%, not by McPherson’s “35%”, in the Levy et al study.
ps: Figure 4 shows the warming of 0.91 degrees by 2100 AD expected to be caused by reducing the “global dimming” atmospheric aerosols air pollution discharges by those 3 percentages listed above.
LikeLike
True – I accidentally parsed the 35-80% in the abstract as the range of aerosol drops being tested in the model, rather than as the range of declines for individual aerosol components. Given that SO2 is the biggest component and most relevant to corona-driven factory shutdowns and the like, this makes Guy’s projection of catastrophe-by-November even more fanciful – I think I fancy my chances of winning my self-made bet with Sisofos even more now 😉
LikeLike
This is some of the best writing on climate change I’ve ever read. It’s challenging to find reasonable voices amongst the crowds of ‘it’s all totally overblown’ or ‘we’ll all be dead by 2026’, but you are clearly one of them. Thanks for taking the time to write about this stuff. You and Mallen Baker would get along well I think. If you haven’t heard of him certainly check out his YouTube channel. Thanks again for your writing.
LikeLike