

This is the fourth post in a new climatetippingoints.info series fact-checking claims that various climate tipping points have been crossed, and that sudden catastrophic warming is now inevitable. See the Introduction post for an overview.
Fact-Check: is an Arctic “Methane Bomb” about to go off?
Claim: A huge amount of methane is trapped in permafrost and methane hydrates in the Arctic and is starting to leak out, and even a partial release could at any time trigger a sudden shock increase in global warming of up to 5°C within 5 years.
Reality: Methane levels have recently increased but so far have a mainly tropical or fossil fuel source. Methane release from permafrost and hydrates will happen as a gradual chronic leak acting as an unwelcome but modest feedback on warming, rather than being a sudden, catastrophic release.
In recent years there have been repeated claims (e.g. 1,2,3,4,5,6,7,8) that a huge amount of methane trapped in Arctic permafrost and hydrate deposits will imminently be released once global warming passes a critical temperature threshold, which will in turn trigger abrupt and catastrophic warming.
In this post of climatetippingpoint.info‘s new Fact-Check series, we investigate how much methane is locked up in the Arctic, how much could be released, and how soon it might happen.
One Percent Rule
A common claim is that there’s so much of the potent greenhouse gas methane stored in the Arctic permafrost (permanently frozen soils rich in organic matter) that even if only 1% of this methane escaped then we’d see a +0.5–1°C global warming jump in just a year.
Let’s look at the numbers. Our current best estimate is that there’s up to around 1600 gigatonnes (Gt – a billion tonnes) of organic carbon locked up in Arctic permafrost soils. One percent of this would be 15 GtC, which if it were released as CO2 would lead to only a modest warming (15 GtC=55 GtCO2, which when accounting for some natural drawdown would drive only +~0.02°C over a few decades). However, methane is a far more potent greenhouse gas than CO2, but it also decays into CO2 with a half-life of only ~10 years. Together, this means that methane produces about 84-86 times more warming than the same mass of CO2 on a 20 year timescale, but decays to 28-34 times more warming on a 100 year timescale. Based on this, if all of that 15 GtC was released from Arctic permafrost as pure methane (=20 GtCH4), it would lead to around 1.1°C of warming in the short-term and around 0.4°C in the longer term (figures updated).
This would seem to support the claim that a release of only 1% of the permafrost methane would trigger a sudden warming of ~1°C. But here’s the key question: can 20 GtC worth of pure methane actually leak out in one sudden event? Here the reality is less dramatic.
The main issue is that not all of the carbon in permafrost would be released as methane. When we talk about organic carbon in permafrost, what we mean are the remains of tundra plants that in warmer climates would rapidly decay and much of its carbon returned to the atmosphere. But in polar climates, these remains can become permanently frozen into deep soil layers known as permafrost, stopping the decay process. This gradually leads to a big build up of undecayed organic carbon, making it a big global sink of carbon. But with warming, these organic-rich permafrost soils begin to thaw out, and lots of this organic material can begin to decay and release gases.
Different types of organic matter decays at different rates, with only some decaying rapidly – in one experiment, 50-75% of the organic matter in permafrost decayed when left unfrozen over 12 years. Most of the bacteria and fungi driving this decay release CO2 as a by-product of respiration, but in waterlogged soils anaerobic bacteria that release methane can dominate instead. But how much methane gets out into the air also depends on the soil and vegetation above, with some being broken down and turned into CO2 on the way. Overall, the proportion of carbon released as methane has been estimated at ~2% of future emissions – nowhere near pure methane, but enough to boost the warming effect of permafrost carbon release by ~40% over the next century. Some CO2 will be taken up by warming-driven vegetation growth in these regions as well, partially counteracting the CO2 release from permafrost thawing.
So how much overall carbon release might we expect from permafrost in the future? Models of future permafrost change are imperfect but improving, and project that around 71–92 GtC could be released by gradual thawing by 2100 under the severe RCP8.5 emission scenario, and up to 200 GtC by ~2300. The former would equate to an extra ~0.2°C of warming by 2100 [with the 40% boost from methane but ~50% of CO2 drawn down by natural sinks]. Another study suggested around 10% of permafrost carbon could possibly be released by 2100 on this emission scenario, which is around 130-160 GtC (i.e. +~0.3-0.4°C) . In contrast, under the lowest emission scenario keeping within the <2°C Paris Target (RCP2.6), the projected release is within 20-58 GtC (+~0.1°C) by 2100, while the IPCC recently estimated that permafrost emissions could reduce the emissions budget for 1.5°C by ~27 GtC (=100 GtCO2). These warming figures are similar to or slightly higher than the 2013 IPCC report’s total scenario range of 0.13-0.27°C by 2100. However, recent research on abrupt permafrost thaw in areas with large ice pockets or unstable slopes suggests the warming impact might actually be nearly doubled compared to the average permafrost response in the models of the 2013 IPCC report.
Together, these studies converge on gradual and abrupt permafrost thawing resulting in additional warming by 2100 of ~0.5°C or more under a severe emission scenario, and around 0.2°C under Paris-compliant emission scenarios. This extra warming represents an unwelcome climate feedback and makes keeping under the 1.5°C or <2°C Paris Targets that much more challenging, but a sudden permafrost methane release triggering 0.5-1.0°C of warming within only a few years is not supported by current research. And contrary to claims that climate models ignore permafrost, gradual permafrost thaw was included in several models in the last IPCC report, although their responses varied widely and didn’t include abrupt thaw.
Short Shelf Life
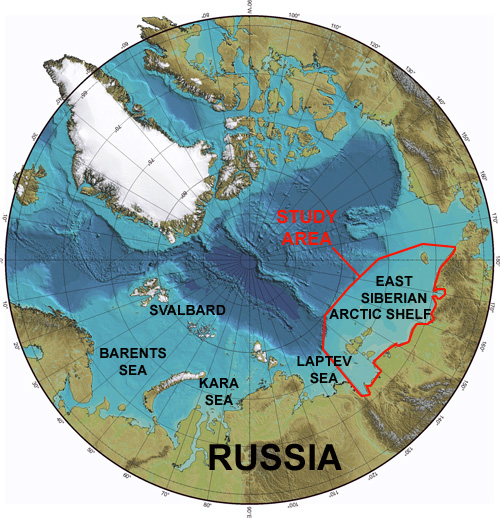
Another big claim is that a region in the Arctic Ocean known as the East Siberian Arctic Shelf (ESAS) is leaking methane out of vast undersea methane hydrate deposits (a pressurised mixture of ice and methane trapped in sediments – see our previous Arctic methane post for more information). The ESAS is said to be poised to release 50 Gt of this methane into the atmosphere, triggering a rapid and catastrophic warming of 5°C in only 5 years (the “ESAS-bomb” scenario). But this claim doesn’t entirely stack up either.
This ESAS-bomb scenario started out with a trio of papers. The first paper found a lot of methane dissolved in the water of the ESAS, which was calculated to represent a surprisingly high release of around 8 Teragrams (Tg – equivalent to a Megatonne, 1000 times less than a Gigatonne) of methane (CH4) a year, and in a more recent paper was updated to 17 TgCH4/year. It was hypothesised that this is the result of permafrost under the seabed thawing and letting methane from hydrates trapped underneath to escape. From this, it was then posited that there could be up to 1400 Gt of methane under a subsea permafrost lid – a massive value for only one regional sea compared with the global methane hydrate estimate of up to 2000 GtC (including ~200 GtC in the Arctic) and 1600 GtC stored in all Arctic permafrost. Finally, a third paper then speculated that 50 Gt of this methane is poised to be released imminently, and could happen in as little as 1-5 years. This would cause extreme and rapid warming, quantified as $60tn worth of economic damage in one paper and which another commentator described as being worse than anything since the Permian-Triassic mass extinction 250 million years ago.
However, other Arctic and methane hydrate researchers have been sceptical of many of these claims, pointing out several major issues.
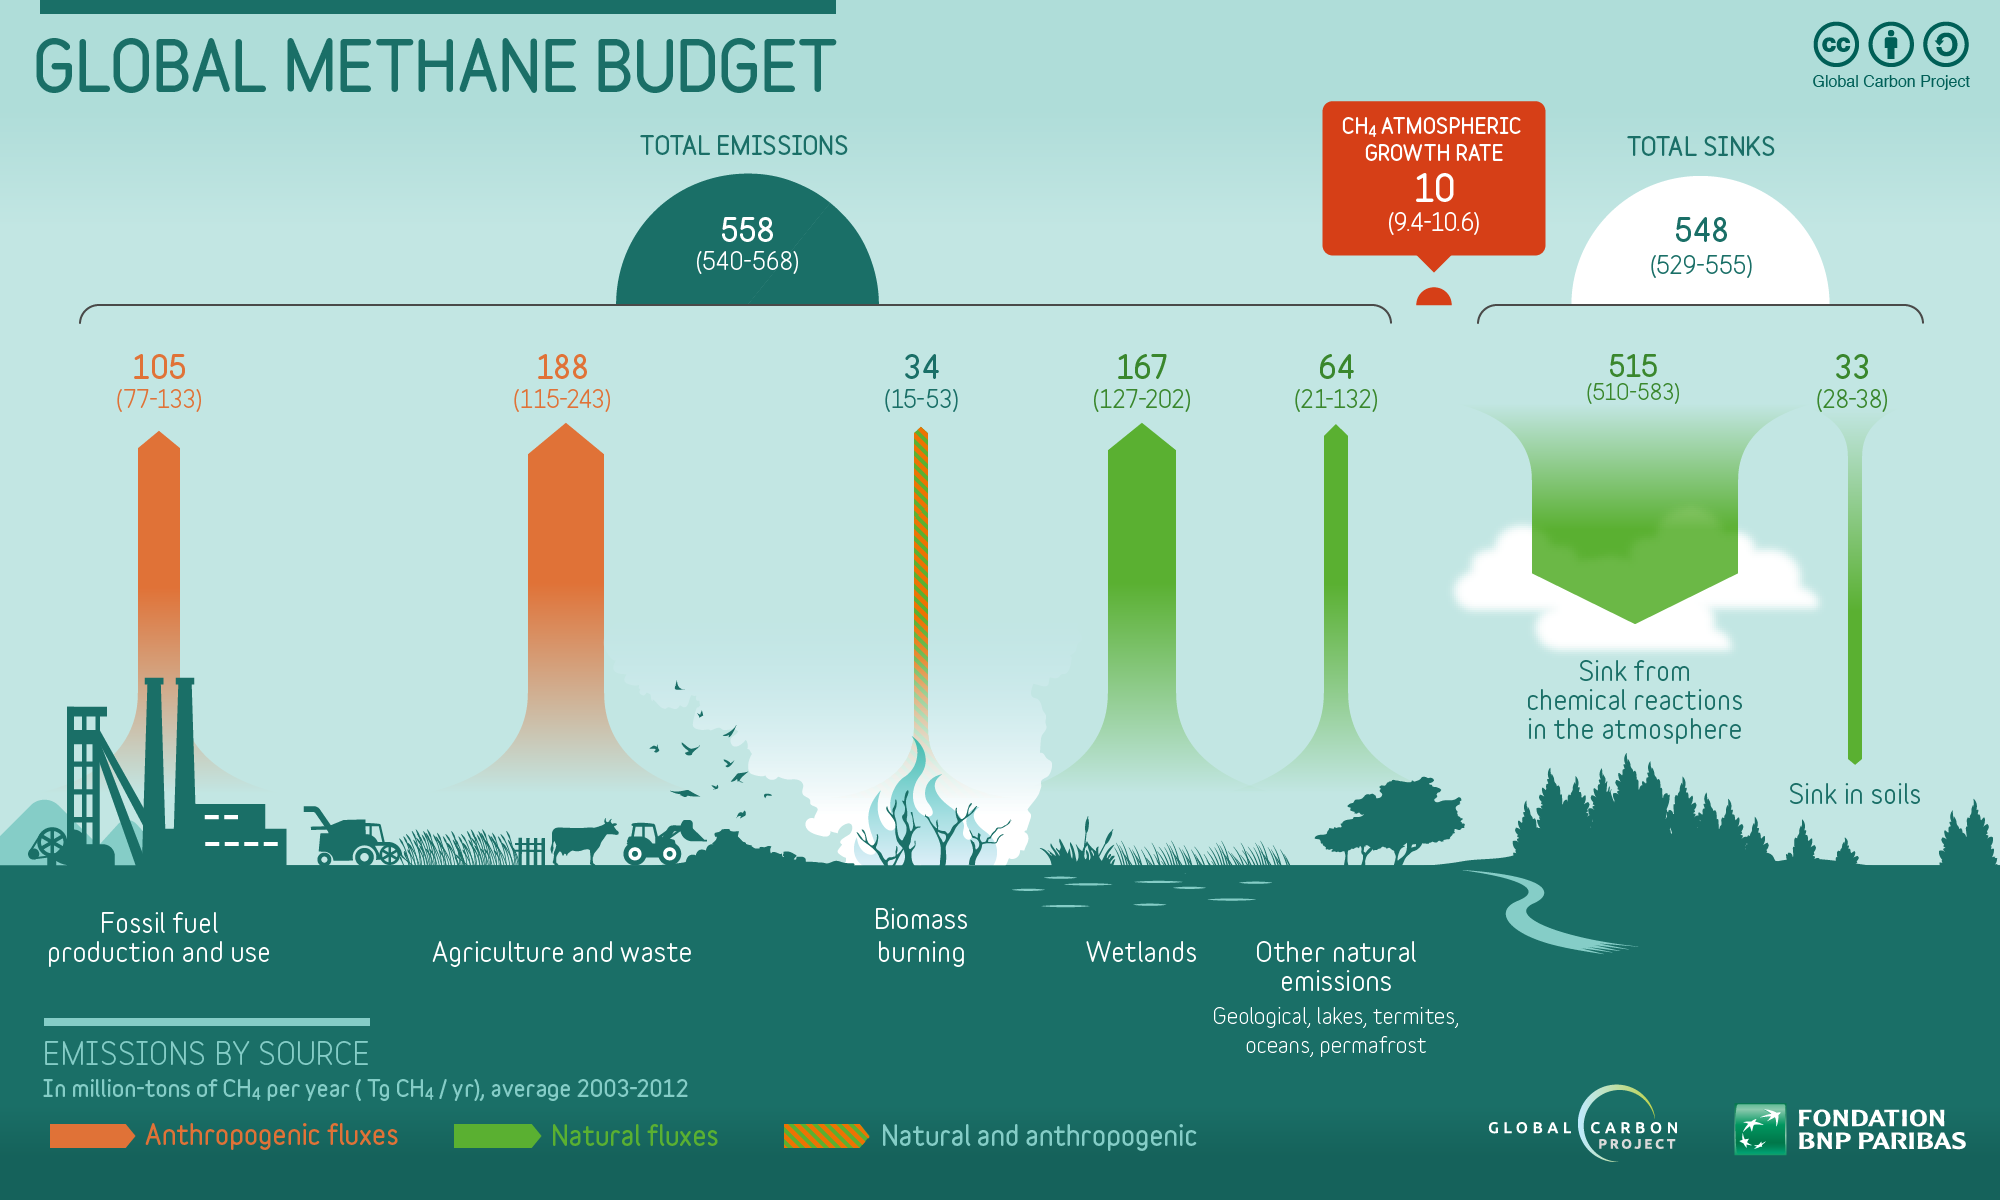
First of all, while the evidence of high levels of methane was clear, there was no conclusive proof of this being a totally new leak. As detection methods have become more sensitive and widely used, more previously unknown sources of methane have been discovered. Some of these – for example the famous methane bubbling off of Svalbard – on further examination turned out to be going on naturally for thousands of years, mostly doesn’t make it to the atmosphere, and may even draw down CO2. Modelling also suggests that even under a shallow sea permafrost has a lag time of hundreds of years behind global warming before significant destabilisation occurs. And although 8-17 TgCH4/year sounds like a lot, on a global scale it’s not huge compared to the average global release of ~558 TgCH4/year – a fact noted in the first ESAS-bomb paper (“…the current estimate is not alarmingly altering the contemporary global CH4 budget“). Subsequent in-depth modelling and statistical analysis of the ESAS data also suggests that winter emissions have been over-estimated, bringing the emissions down to a more modest 0-4.5 TgCH4/year from a mostly biogenic permafrost source. This fits with a recent research cruise using accurate methane detectors, which estimated ESAS emissions of ~3-4.7 TgCH4/y.
Second, there is even less proof of the existence of such a huge methane hydrate reservoir directly under the subsea permafrost. The claim in the second ESAS-bomb paper is based not on their own observations as sometimes reported, but on two old and hard-to-find sources and from considerable assumptions and indirect extrapolations. Although hydrate deposits have been found across large areas of the Arctic (around 200 GtC), none of the studies claimed in support of the ESAS-bomb actually prove the existence of deposits specifically under the ESAS as massive as 900 Gt (less than 1400 Gt as 500 Gt of the headline figure was general organic carbon rather than methane). Given that methane hydrates only forms under high pressure (unless it is in a rare metastable state, for which clear evidence in the ESAS is still lacking), it’s also likely that most of it lies further below the seafloor and will take a while for warming to reach and for the gas to then travel up. It’s notable too that more recent work from the same research group no longer specifically posits a 1400 GtCH4 reservoir ready to rapidly release 50 Gt.
Thirdly, the evidence for a rapid 1-5 year release is also limited. The initial scenario in the third ESAS-bomb paper was based on extrapolating a 5% emissions growth rate over 50 years, leading to an eventual emission of 50 Tg/year. However, a typo in the original paper stated this as 50 Gt instead, which has since been clarified. The paper then adds a 1-5 year release scenario based on the stated assumption that ~3-5% of the seabed is vulnerable to instability, and so a similar percentage of the assumed massive methane reservoir (stated as 50 GtCH4) would be immediately released if this area slumped. But as we’ve explained, the evidence for such a large reservoir of free methane is shaky, and no justification is given for 3-5% of the ESAS seafloor simultaneously collapsing. Supporters of the 1-5 year scenario cite various papers stating that methane release this rapid is possible, but these papers actually only support releases over several decades rather than only a few years. Even so, the warming modelled for the rapid 5 year release was only an additional 1.3°C rather than 5°C as often quoted. Based on our earlier sums, even if 50 Gt of pure methane were emitted all at once it would lead to 2.6°C of short-term warming rather than 5°C (figures updated – see the comments for calculation details).
Finally, there’s no evidence that a dramatic methane release occurred from Arctic methane hydrates during past episodes of Arctic warmth and rapid warming, most notably during the warm Eemian interglacial, deglaciations, or Holocene climatic optimum. Some have suggested this is because ice bubbles in cores form too slowly to capture rapid methane releases. But these processes (known as diffusion and smoothing) only loses some of the annual signal and can be mathematically recovered, and a large part of rapid spikes would still be captured anyway. The resulting 5°C warming within a few years would also definitely be clear – but is clearly lacking – in many other types of palaeoclimate records. Claims that the Eemian had too different an orbital seasonality to be relevant ignore that the Arctic was still 2-4°C warmer than today, with forests reaching the Arctic Ocean and hippos living in the River Thames. And while records of Eemian permafrost melt show that a significant part thawed when warmth hit 1.5°C above pre-industrial, temperatures didn’t go up much higher as a result. This indicates that this isn’t an abrupt tipping point for rapid warming. The thawing also occurred on land, which responds a lot quicker to warming than under even a shallow sea.
Overall, since 2010 evidence has accumulated that the ESAS is releasing more methane to the atmosphere than previously realised, and so constitutes a fairly significant global methane source. But there’s little evidence that all of these emissions are entirely new and driven by global warming, and claims of vast stores of free methane gas lying just under the seabed ready to be abruptly released are highly speculative and unproven. Claims that critics have insufficient expertise for this specific sea also ignore the critics’ wide-ranging and relevant experience across both Arctic and methane hydrate science.
Exponential Claims
Several sources go on to say that methane concentrations in the atmosphere have already started to go up exponentially, and as it’s highest in the Arctic that this proves that Arctic methane is the source.
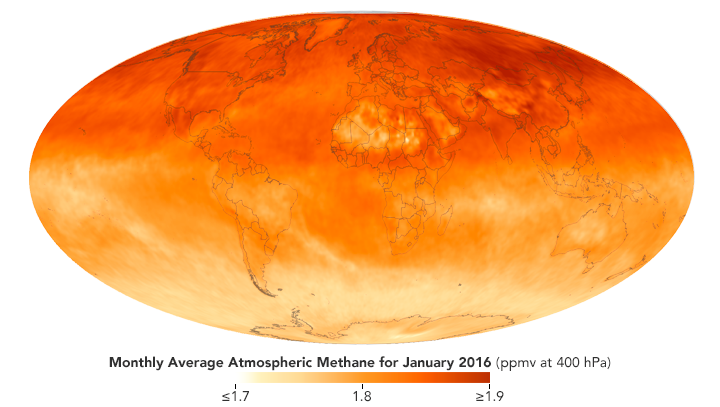
Here’s the recent record of methane concentrations in the atmosphere:

There clearly has been an increase in global methane concentrations since around 2007, and at a faster rate since 2015. But the increase is not exponential, either in its narrow mathematical definition or in the broader sense of continuously accelerating increases. The long-term trends in methane are far more erratic than the smooth increase in CO2, with for example an 8 year hiatus (with uncertain causes, but possibly from quicker methane breakdown) before growth resumed in 2007. Some sources try to project exponential increases based on this, but these are based on extrapolating from a few selectively chosen data-points with poor trend-fitting techniques that ignore the actual dynamics of what’s driving the increase (as explained in our previous Arctic sea ice fact-check). But where is this recent increase in methane concentrations coming from?
Methane sources can be tricky to pinpoint, but researchers can use tracers such as its isotopic signature (the balance of heavier and lighter atoms of the same element) and global patterns to narrow it down. Modelling using these isotopes and concentration patterns indicate that the recent increase is mostly from either tropical or sub-tropical sources (e.g. from farming or wetlands), fossil fuels (e.g. natural gas leaks), and/or a slowdown in how quickly methane breaks down in the atmosphere. This modelling also indicates that after 2007 it’s mostly not been coming from polar regions, which would rule out Arctic permafrost or methane hydrates as the driver of the recent increase.
This also matches with global methane budgets, which try to measure sources and sinks of methane around the world and have found no significant increase for Arctic methane (at about 1 TgCH4/y from permafrost and 2 TgCH4/y from hydrates). Although some of these estimates are more uncertain than for CO2 this doesn’t mean there’s not a reasonable consensus (as some claim otherwise) on the overall trend, especially on the gap between sources and sinks that’s driving the observed increase. As there’s quite a bit of uncertainty for each source but more certainty on the total source/sink difference, discovering that one source is bigger than previously estimated would mean that the others would likely be smaller instead, rather than this counting as a definite overall increase in emissions. And as with climate skepticism, the presence of uncertainty and debate over the details of the mainstream understanding of atmospheric methane does not make the opposite alternative just as likely and worthy of equal credibility.
Hard to Concentrate
Some people question the relevance of the global average methane concentration record though, and point to some higher concentrations detected high up above the Arctic as proof of an Arctic methane leak. This is justified by claims that the Arctic Ocean is under-sampled at the surface, and that the difference between surface and mid-altitude concentrations supports a methane hydrate source causing methane plumes.
But while Arctic methane concentrations are often higher than the global average, this doesn’t actually make it likely that’s where methane is coming from. Most methane emissions comes from the northern hemisphere as it has greater land area than the south and so contains more key methane sources like wetlands (and humans!). As the Arctic lies at the northern hemisphere’s centre this effect is felt greatly there. Methane concentrations also heavily depend on other factors, including the rate of its breakdown by chemicals known as free radicals of which there is less at the poles and more towards the tropics. Together, the overall effect is that slightly more methane tends to naturally accumulate in the northern hemisphere anyway, and especially in the Arctic.
Another problem with these claims is that the data shown is often an extreme outlying value cherry-picked from raw unprocessed data on one day or week (e.g. 1,2,3). These values are often far above times before and after, making the situation seem far worse than it actually is. For data to be useful though it has to be interpreted within its full context, much like one week of intense cold weather does not disprove the long-term global warming trend. It’s the global trend that determines methane’s total impact on global warming, rather than temporary local fluctuations. These can have many causes (e.g. weather patterns and local decay rates) other than an increase in methane sources.
Finally, claims that patchy data collections from the surface ocean means that we under-estimate Arctic methane concentrations also ignore the data provided by satellites across all altitudes, as well as the overall constraints provided by global methane budgets that use multiple different data types and methods. Methane tracking and budgets are not solely dependent on surface station data, which complement the other methods. Recent research cruises have helped fill some of these gaps as well.
This is linked to a claim that measurement stations and satellites fail to spot intense methane plumes rising from Arctic methane hydrates, and that this is supported by methane concentrations being higher at mid-altitudes after spreading out. But no evidence is provided for the existence of super-concentrated plumes that hardly spread out in the lower atmosphere (in spite of clear evidence of polar regions having more effective horizontal than vertical methane transport), and there are many other mechanisms driving higher concentrations further up. Measurement and models of atmospheric methane show that methane decays far more quickly at the surface (within ~1 year) than the mid-upper troposphere (i.e. mid-altitude atmosphere, where it lasts ~12 years), and especially during polar winter in the latter (~1000 years). A recent cruise across the whole ESAS found a few bubbling hotspots, but these weren’t large enough to drive significant emissions and were nowhere near as big as superplume proponents have suggested.
As well as this, surface and mid-altitude methane have opposite yearly cycles, with surface concentrations lowest (due to more rapid decay) and mid-altitude concentrations highest (due to increased upwards convection and a higher tropopause) in the Arctic summer and vice versa. This naturally leads to higher methane concentrations in mid-altitudes than at the surface. The changing gradient in March cited as proof of methane plumes is likely to be due to this summer contrast between surface and mid-altitude concentrations arriving earlier in the year with warmer springs. Using mid-summer methane profiles would no doubt have shown a constant long-term pattern instead.
Summary
More methane – a potent greenhouse gas – is likely to be emitted from Arctic permafrost than the IPCC originally anticipated, but modern models have started to catch up and quantify them better. Permafrost emissions are likely to drive ~0.1-0.3°C of extra warming by 2100 under low emission scenarios and up to ~0.5°C under high emission scenarios. But there’s no evidence for massive releases of pure methane over only a few years either now or in the past. Similarly, while evidence has emerged of greater than anticipated methane emissions from subsea Arctic permafrost in the East Siberian Arctic Shelf, there’s scant direct evidence of a huge reservoir of metastable methane hydrates just below the surface that could suddenly leak and trigger extreme warming.
Methane concentrations in the atmosphere have begun to increase again after 2007 and more rapidly since 2015, but the increase is not exponential and the likeliest drivers are towards the tropics rather than the Arctic. While there’s still large uncertainties on individual methane sources and sink estimates, there’s still a reasonable consensus on the overall global balance and trends. And higher mid-altitude methane concentrations above the Arctic (with occasional very high local readings) are mostly driven by regional atmospheric dynamics rather than undetectable methane plumes.
The most likely situation then is one of a gradually growing chronic leakage of additional methane and CO2 from the Arctic over the coming decades and centuries, rather than an abrupt “methane bomb”. This will act as a gradual amplifier of human-driven global warming, making staying within the Paris Targets of 1.5-2°C even more challenging and urgent.
~
Updated on: 17/5/19 to correct the methane warming calculations for permafrost and the ESAS-bomb (see comment section for details); 17/10/19 to clarify the permafrost warming estimates (no significant change overall); 31/1/20 with new study supporting modest ESAS CH4 emissions; 17/2/20 to add new study giving more details on abrupt thaw potentially doubling permafrost emissions versus the CMIP5 average; 12/2/21 to ensure clarity and consistency in permafrost-induced warming estimates, and add IPCC SR1.5’s estimate.
This post was written by Dr. David A. McKay, currently a Postdoctoral Researcher at Stockholm Resilience Centre (Stockholm University), where he is part of the Earth Resilience in the Anthropocene Project (funded by the European Research Council) and is researching non-linear climate-biosphere feedbacks. This post was written in his spare time with no funding support for this site.
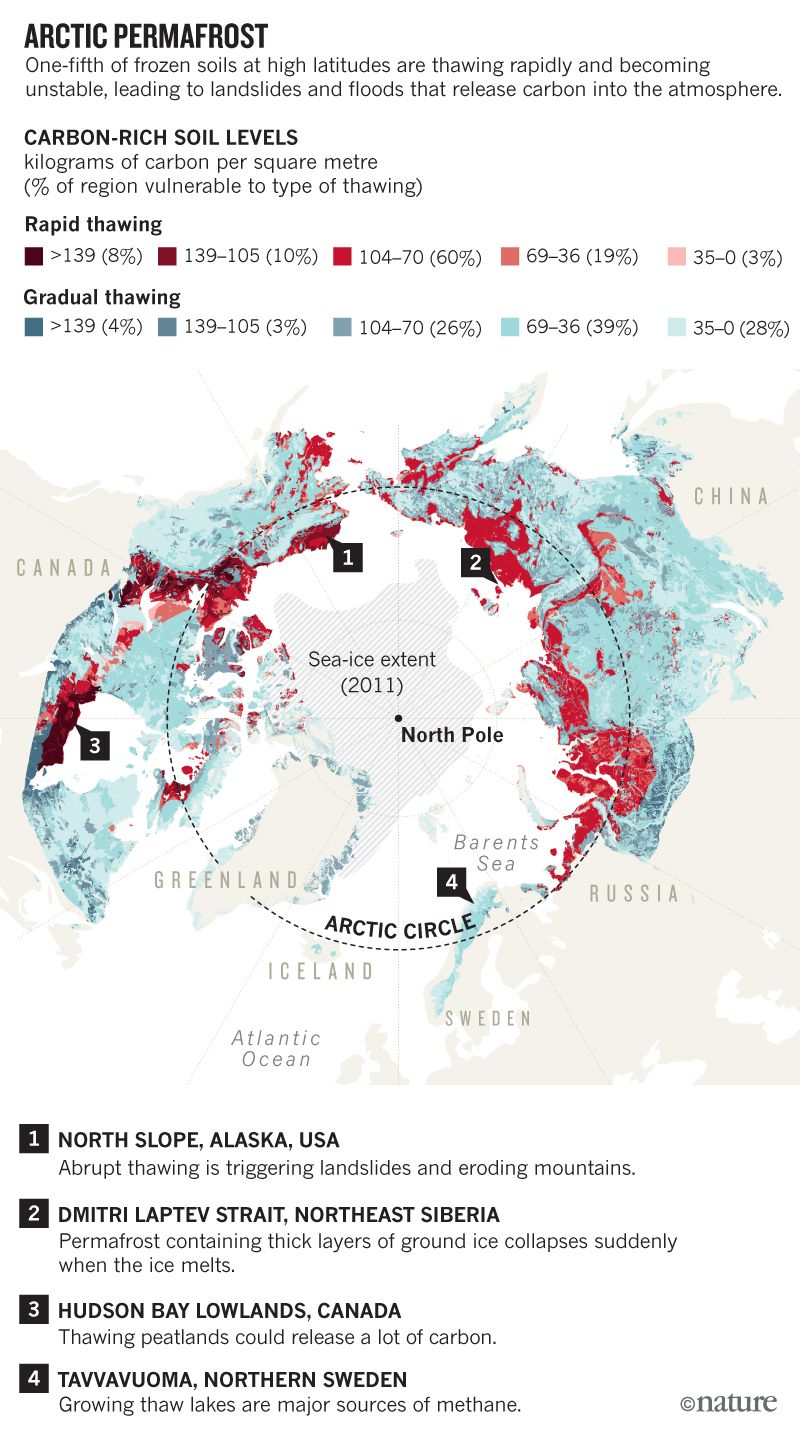
Featured Image: Permafrost thaw ponds in Hudson Bay Canada near Greenland. By Steve Jurvetson – http://www.flickr.com/photos/44124348109@N01/2661598702 en:Flicker.com, CC BY 2.0, https://commons.wikimedia.org/w/index.php?curid=34436593

Really nice write up! However, I am confused about one statement in this article; “1.3°C rather than 5°C as often quoted. For such a big release of pure methane this is actually quite a low figure – based on our earlier sums 50 Gt of pure methane emitted all at once would lead to a whopping 9°C of warming!” What should be believed here? Should the modelling of 1.3°C be believed, or the authors own calculations of 9°C? For a layman like me, it becomes difficult to understand when all of these other alternatives get thrown around, especially with the regards of 50 Gigatonnes where I’ve heard statements of Wadhams 0.6°C, Shakhova’s 1.3°C, and now 9°C.
LikeLike
Hi, good question. I had to double-check this before publishing too, as it was quite confusing. I believe it’s probably mostly due to different assumptions in how quickly the methane is released. It also turns out I actually made a commonplace carbon/CO2/methane mass conversion error in this section, so the pure methane warming would not be quite as much as 9°C (but it’s still more than in Shakhova’s paper). I’ve updated the article with the corrected figures, and explain the details below. Thank you for drawing my attention to it!
My calculation was based on an instantaneous release of 50 Gt of pure methane – a very unlikely scenario, but a useful thought experiment that’s not far off what some people have proposed online. 50 Gt of CO2 would push up atmospheric CO2 by ~6.4ppm, which would drive around ~+0.03°C of warming (using TCS and a 415ppm baseline). But methane is c. 85 times more effective than CO2 in the short-term, so that’d boost this warming to ~+2.6°C (before declining). My mistake here was initially calculating 50 Gt of *carbon* rather than of specifically CO2, which as each 1ppm of CO2 equates to 2.12 Gt C or 7.81 Gt CO2 and global warming potentials are done on a tonne-per-tonne basis meant I accidentally boosted the numbers. Apologies for that… But 2.6°C is still higher than the 1.3°C claimed by Shakhova, as you point out.
I’ve read through Shakhova’s paper and the methodology isn’t entirely clear, but if their peak radiative forcing (~+6.5 W/m^2) they model for their warmest scenario were maintained it would result in a far higher warming (~3.3°C, using a Transient Climate Sensitivity of 2°C per 2xCO2 – similar to my new figure of 2.6°C too) than what they actually show (1.3°C). However, this high radiative forcing falls soon afterwards as the methane decays, so the system is never in equilibrium and temperatures do not have enough time to catch up with the peak forcing. I haven’t checked their radiative forcing sums either, so can’t vouch for those figures.
I believe Wadham’s figure is lower because they modelled a decade-long pulse of 50 GtCH4, which is long enough that most of the initial methane released will have decayed by the end of the pulse, resulting in a much lower peak methane concentration and radiative forcing overall. Shakhova’s peak scenario was a release within 1-5 years, allowing a bigger methane buildup before it’s reduced by decay. My sum is for instantaneous less-than-a-year release, so is the extreme case. This fits with the slowest release rate (Wadham) getting the lowest warming (0.6°C) and the fastest (me) the highest warming (2.6°C), with Shakhova’s 5y release in the middle (1.3°C). But this all has the caveat of a rapid release of 50 GtCH4 being relatively unlikely, and a more longwinded leakage being most likely.
LikeLiked by 1 person
Thank you for a really detailed reply, David! I’ve been confused around the subject of a 50 Gigatonne release for a while, so it’s nice to finally see some numbers and details around it all.
LikeLiked by 1 person
Upon re-reading I have a few more questions I’d really like answered. This must be annoying, sorry!
From reading your article and comment it seems that the generic “C” has a higher value than CH4 and CO2? As in, C appears to have more potential than both of those. Not sure if that statement makes sense. Specifically it’s about this: “as each 1ppm of CO2 equates to 2.12 Gt C or 7.81 Gt CO2” statement. How much CH4 is needed for 1 PPM of CO2?
50 Gigatonnes of methane would be the equivelant of 4000 Gt of CO2 and boost the methane burden in the atmosphere to ~20-21 PPM, how much is this in CO2e PPM? It seems that it would more than double the CO2e temporarily, before it decays.
Third; Would the peak of 2,6°C even be reached? There’s a multitude of negative feedbacks to hold such an immense and quick warming down and make it more gradual, if I’ve understood a few things correctly.
Thank you for any response, I know it must be annoying to have someone pester you about things like this.
LikeLike
No problem, comments and questions help to clarify future posts!
So by generic C I’m referring to the amount of “pure” carbon locked up in various forms, but it is rarely stored as pure carbon in the Earth (unless it’s graphite or diamond) or released as pure carbon into the atmosphere (except soot). Carbon in places like permafrost is locked up within organic matter, which is normally come combination of carbon, hydrogen, and oxygen atoms in various different molecules but generically represented as CH2O. Carbon has an atomic mass of 12 while hydrogen is 1 and oxygen is 16, so a molecule of CH2O weighs 2.5 times a single carbon atom (as CH2O has a combined atomic mass of 30, versus 12 for C) and means organic matter containing 50 GtC weighs 125 Gt itself in total. When this organic matter is then degraded and respired, if all 50 GtC was released within CO2 then it’d be 183 GtCO2 (as CO2 atomic mass = 12 + 16 + 16 = 44 – the extra mass is from atmospheric oxygen), but if it were all degraded anaerobically and released as methane it’d be 67 GtCH4. Similarly, 1 ppm of CO2 in the atmosphere is equivalent to 7.81 Gt CO2, of which 2.12 Gt is just the carbon without the O2 (as 12/44=0.272). When measuring carbon storage climate scientists tend to measure it in terms of pure C to make conversions between different forms easier, but you have to remember to turn it back into CO2 or CH4 when calculating warming impact – which is what I initially forgot to do!
If 50 Gt of pure methane were released in one go (unlikely as discussed before, but lets work on it as a useful hypothetical), then it’s global warming potential on a timescale of over a couple of decades is equivalent to 4250 GtCO2 (as it’s ~85 times more powerful). This would translate to a temporary ~+544 ppm CO2 in the atmosphere. So yes, a more than doubling and would translate to a +2.6°C warming (assuming 415 ppm baselined and a transient climate sensitivity of 2°C) as calculated before.
But as you point out, this is very much the maximum warming, with many factors limiting the actual likely warming. The main issue is that even an instantaneous release of methane would begin to rapidly decay, which combined with the warming lag (the delay between increase in radiative forcing and temperature catching up) means that by the time temperatures are increasing the total radiative forcing would already be falling again. This would make the peak warming a bit later, lower, and smoother than the methane spike itself. This can be seen in the projections of Wadhams and Shakhova, who (as well as using a multiyear methane release) project substantially lower than 2.6°C peaks delayed by a few years after peak methane. To get the full likely warming from my hypothetical instantaneous 50GtCH4 release we’d have to use a climate model that resolves methane decay and warming lag, but it would likely not reach the maximum 2.6°C in practice, although probably still a bit more than Shakhova’s 1.0-1.3°C as they used a 1-5 year release rather than instantaneous.
LikeLiked by 1 person
You’ve been all too kind answering all my questions in such a great manner! The only thing I’m left wondering is if this calculation accounts for indirect forcings (water vapour, ozone etc.)? Or is that where the TCS comes in?
LikeLike
No problem! And yes you’re right, the Transient Climate Sensitivity automatically includes the effect of fast feedbacks like water vapour on the direct CO2-driven warming (with ~1°C from CO2 and ~1°C extra in fast feedbacks for a doubling of CO2 equivalent), so those warming calculations include the known predictable feedbacks. For longer timescales of around a century the slower feedbacks push up the sensitivity by another degree or so, and even more on a millennium-plus timescale.
LikeLiked by 1 person
From reading your replies and a few other sources I think I’ve come up with a relatively reasonable conclusion relating to this. It seems that it would be roughly as bad as a continued business as usual. Actually, it’s probably not as bad long-term because of the short atmospheric life of CH4, while CO2 remains virtually forever in a human sense.
Yet again, thank you so much for answering all my silly questions and allowing me to learn more about the science and scenarios, I’ll make sure to keep following your blog for other potential posts!
LikeLike
Yes, I think that’s a reasonable way of looking at it. In the Intro post [climatetippingpoints.info/2019/04/01/climate-tipping-points-fact-check-series-introduction/] I put it in terms of risk, with climate tipping points and feedbacks loading the dice a bit more against us by making high warming scenarios slightly more likely than otherwise (for example, in one study the upper 5% probability temperature shifts from 4.9 to 6.5°C due to tipping point risks). This means even if we stuck to an rcp 4p5 or 6p0 scenario (which represents current commitments), the chance of warming overshooting and going closer to rcp 8p5 (i.e. business-as-usual) might be somewhat higher than we originally thought.
Thanks for your questions and feedback!
LikeLiked by 1 person
any other mistake????
LikeLike
No I don’t think so, but if anyone thinks they’ve found one then feel free to let me know 😉 – I’m willing to check!
LikeLiked by 1 person
Is the warming including water vapour
LikeLike
Hi Yinn, yes all the warming estimates implicitly include things like the water vapour feedback. This is because I’ve used the Transient Climate Sensitivity of ¨2°C per doubling of CO2 (for timescales of the next few decades), which includes around 1°C for direct CO2 warming and 1°C of fast feedbacks, most of the latter being driven by water vapour. For longer timescales (e.g. around a century) the Equilibrium Climate Sensitivity of ~3°C per CO2 doubling is used, which adds on the effect of the slower feedbacks as well.
LikeLiked by 1 person
Hi, glad to see you debunking the methane bomb myths. I wonder if you know about this recent 2018 models roundup type review – which found that conclusions for the melting of the terrestrial permafrost are much less than these estimates. If I use their RCP 4.5 figures, whihc is about what we are on, it is less than a tenth of a degree by 2199 and it can remain carbon negative all the way through to 2199. It seems to be currenlty carbon negative.
I did a general debunk here
https://debunkingdoomsday.quora.com/Arctic-Canadian-and-Siberian-permafrost-carbon-release-significant-but-exaggerated-in-news-stories-fraction-of-a-de
The section on the 2018 review paper is as follows:
For 2.4°C by 2100 (RCP 4.5), the models range from 66 gtons loss of CO2 to a 70 gtons gain BY 2299. (A petagram is the same as a gigaton, a billion metric tons).
The reason it can go carbon negative is because of the growth of peat and ground cover which offsets the methane emissions.
For 4.9°C by 2100 (RCP 8.5 or “business as usual”), then it is between 74 and 641 gigatons emissions by 2299.
As we saw, RCP 8.5 is not a realistic futue. There is no way we are gong to do that even with existing policies – and to get to that scenario means not just reversing all our policies now, but no reductions at all through to 2199.
To get a rough idea of what that means, then at 420 gigatons for half a degree, then 642 gigatons is about 0.76 C and the 70 gigatons of the 2.4 C path is about 0.083 C or about a twelfth of a degree (and 66 gigatons is a net reduction by a fourteenth of a degree).
So, roughly, we are headed for at most 0.76 C by 2199 with “business as usual” and if we can get down to 2.4 C by 2100 then it’s at most a twelfth of a degree by 2199, in both cases most of that after 2100.
Their conclusion says:
>”Despite model uncertainties, the results of this study indicate that, under climate change trajectories resulting from little or no mitigation effort, such as the RCP8.5 climate we considered, the northern permafrost region would likely act as a source of soil carbon to the atmosphere, but substantial net losses would not occur until after 2100. Under climate change trajectories resulting from more aggressive mitigation, such as the RCP4.5 climate we considered, our analysis indicates that the northern permafrost region could act as a net sink for carbon. These results have significant implications for climate mitigation policies, as they indicatethat effective mitigation policies could attenuate the negative consequences of the permafrost–carbon feedback that are likely to occur under policies that result in little or no mitigation.”
>Dependence of the evolution of carbon dynamics in thenorthern permafrost region on the trajectory ofclimate change (https://www.pnas.org/content/pnas/115/15/3882.full.pdf)
In that paper they say that there would be more of a carbon sink if it weren’t that the plants are reduced in growth due to lack of nitrogen in the soil. With more nitrogen in the thawing permafrost there would be much more of a carbon negative effect here
[If you spot any errors be sure to say!]
LikeLike
Hi Robert, thanks for your comment.
So the permafrost release scenario of 130-160 PgC by 2100 (based on a model range of 37-174 PgC) I quote is from Schuur et al (2015), and is based on rcp8p5. This range broadly ties in with the study you link to (McGuire et al, 2018), who show a model range of soil carbon change of approx. +40 to -180 PgC by 2100 for rcp8p5. However, they also project an increase in vegetation carbon due to boreal forest expansion in these regions (although with a very large range as dynamic vegetation models disagree a lot in these regions, with modelling of nitrogen availability being particularly limited – most indications are that global vegetation gain will be less when accounting for N changes), which leads to a net ecosystem carbon change of +200 to -40 PgC by 2100 for rcp8p5. Schuur et al (2015)’s numbers don’t include this vegetation change, so could be seen as overestimating total carbon loss for the tundra region. However, it should also be remembered that boreal forest expansion in the tundra region is also at the expense of boreal forest loss further south to steppes, and it’s not clear that the boreal forest northward shift leads to a net global carbon storage gain (whereas permafrost loss is definitely a net global loss). This means the difference between the modelled net carbon change ranges depends on whether one calculates the net change for just the tundra region itself or globally. Personally, I prefer that permafrost soil carbon loss is reported separately to the overall boreal forest shift carbon changes to make sure the net global impact is clear, but it’s worth bearing in mind that on a regional scale the ecosystem may temporarily gain carbon.
Either way, the different studies here definitely agree that carbon loss from permafrost acts a long-term feedback with most of the impact after 2100 with much of the initial loss probably offset by vegetation gain. There are large uncertainties though, with for example the recent paper by Turetsky et al (2019) [https://www.nature.com/articles/d41586-019-01313-4] suggesting that thaw craters could drive carbon loss a bit faster than considered in models so far. The evidence on its current status is also unclear – at least one review found evidence of tundra being a net CO2 source over the last few decades: http://doi.wiley.com/10.1111/ele.12164. The total permafrost carbon pool size tends to be underestimated in models by as much as half as well, which might downwardly bias current emission projections.
As for the appropriateness of rcp8p5, many studies used rcp8p5 as a reporting baseline as it’s the scenario that our emissions were roughly tracking in 2014 [https://rdcu.be/bFDEd], although now it’s more in the middle [https://www.carbonbrief.org/analysis-why-the-ipcc-1-5c-report-expanded-the-carbon-budget] (although technically rcp 4p5 & 2p5 is greater than rcp6p0 CO2 ppm at this point due to scenario details – they’re all pretty close though). However, as you point out there’s some debate as to whether rcp8p5 is a realistic future. It’s been argued that there simply isn’t enough extractable fossil fuels to provide this much carbon, although this assumes there aren’t many more large undiscovered deposits left to find. Governments have also made commitments towards the Paris agreement that if kept to would bring us down to between rcp4p5 and rcp6p0, although this assumption of course depends on if they fulfil their promises. Overall, I think rcp8p5-level human emissions are unlikely (but not impossible) with reality likely to be more like rcp4p5-rcp6p0, but that long-term natural feedbacks are likely to somewhat amplify anthropogenic emissions more than accounted for in IPCC AR5’s rcp scenarios. As a result, rcp8p5 should be seen as the worst-case feasible scenario – not necessarily likely, but worth studying anyway as motivation to avoid it! The next IPCC round (AR6) will have new more realistic scenarios, and its models will better resolve permafrost and vegetation changes, so hopefully will help resolve some of these questions.
Also a check on your warming estimates – by my estimate, an example 70 GtC release would lead to +33 ppm CO2 (based on 2.13 GtC per 1 ppm CO2), which assuming a current CO2 baseline of 415 ppm CO2 would lead to a short-term warming of ~0.15°C and a longer-term warming of ~0.24°C (based on a Transient sensitivity and Equilibrium sensitivity of 2°C and 3°C per CO2e doubling respectively).
LikeLiked by 1 person
Hello! I highly appreciate these articles, and they are an amazing way to help me not freak out over overexaggeration.
However, what do you think of the idea of the freeform gas underneath the ESAS, as stated in https://envisionation.co.uk/index.php/nick-breeze/203-subsea-permafrost-on-east-siberian-arctic-shelf-now-in-accelerated-decline ? The place I usually get these articles from is not particularly helpful, and pushes the fact that we’re doomed.
Forgive me if this is already covered, I’m not too well versed in the world of climate science.
LikeLike
Hi Tyler,
This topic is mentioned in the “Short Shelf Life” section in this post, in which we discuss the claims that there’s a huge amount of methane ready to be released from the East Siberian Arctic Shelf (ESAS). In short, while they definitely have detected some reasonably significant methane emissions in the region (although the yearly flux is probably less than they estimated), they’ve provided no direct observations or evidence that this is from modern hydrate destabilisation or a vast free gas reservoir. No-one has actually found hydrates or free gas down there yet, but it’s treated like it’s certain and quantified as a huge reservoir.
Firstly, the leak they detected is likely to have been going on for millennia already, with several similar sites having long-term leaks as a result of ice sheet retreat. Better data collection and instruments means we’re now finding it, but extra evidence would be needed to establish an acceleration due to modern warming. The 1400 Gt of hydrates and 50Gt of free methane figures often quoted was originally a speculative hypothetical scenario based on several significant assumptions and extrapolations (detailed in the post), but has now been quoted so often as to seem like a real estimate of observed gas. [When I tried to source the first figure I came to two offline russian papers from the 80s I couldn’t source, so it’s hard to check]. This also goes for their 1 to 5 year release of free methane scenario, which was a speculative scenario used for a worst-case modelling scenario based on extrapolation rather than significant evidence. Lastly, if this shelf was so capable of massive free methane releases it likely would have also erupted during previous similarly warm periods in the Arctic (like the Eemian or early Holocene), but no evidence of this has been found in the geological or ice records.
In the linked post Shakhova does make a case for why low pressure hydrates (a key debated assumption) could be below ESAS, but the reasons given are again fairly speculative (with no actual pressure or hydrate measurements) and still don’t justify for example why they assume things like the whole sedimentary column holds hydrates. A key paper in response to these claims (https://agupubs.onlinelibrary.wiley.com/doi/full/10.1029/2011JC007218) found that under current warming trajectories it will take centuries for the subsea permafrost to degrade significantly (because of thermal intertia), which means even if there was lots of methane trapped underneath it’s still fairly well trapped in the meantime (unless we assume it can come out of just a few holes, but that is highly speculative too).
For more details and links check out the “Short Shelf Life” section, and if anything there isn’t clear let me know and I can clarify it!
LikeLiked by 1 person
Thanks for the reply! I greatly appreciate it.
I guess I didn’t make the full connection to it there, really. If I remember right (could also be horribly wrong), they’re treating it as such due to how the permafrost/ice/??? of the region acts a certain way, from what I’ve read.
This is all incredibly helpful for the doom and gloom chaos frequently found- it’s bad enough already, let alone with misused sources. Thanks!
LikeLike
No problem, glad it’s helpful!
The crux of their argument that this permafrost/hydrate region is special (at least as summarised in a comment in https://envisionation.co.uk/index.php/nick-breeze/203-subsea-permafrost-on-east-siberian-arctic-shelf-now-in-accelerated-decline) is that a combination of the permafrost forming a lid at the seafloor, plus some sort of pore-freezing effect when the shelf was above sea level, helps pressurise the sediment underneath to preserve some of the original hydrates and trap any methane from hydrates that have dissociated. Otherwise, under normal conditions you only get hydrates forming in sediment under 100s of metres of sea, because it requires both low temperature and high pressures. But these justifications remain fairly hypothetical and speculative – the article has an awful lots of telltale “coulds” here – and it remains the case that there’s little direct observational evidence of any very shallow hydrates or large volumes of free gas in this region. The pressure figures given in the article here are interesting too – 5-8m of permafrost needed to pressurise versus 10m of water isn’t actually that big a difference in depth terms, and to me that doesn’t justify hydrates being that much shallower… I also remain very sceptical about assuming the whole ~2000m sedimentary drape could host hydrates (which is what makes it a vast reservoir), when everywhere else hydrates have a lower bound some 10s to a few 100 of metres deeper for clear thermomechanical and chemical reasons [I helped do some hydrate modelling a while back to do with interactions with climate, and we used very typical thicknesses of 30m in shallower water and 150m in deeper, colder water: https://agupubs.onlinelibrary.wiley.com/doi/full/10.1002/2016GL069676%5D.
I think the case remains that simple subsea permafrost degradation (much of it relict from post-glacial changes, with an increasing modern climate component over time) is more than sufficient to explain their methane readings, and that extraordinary claims beyond that require extraordinary evidence to justify them. It’s fine for them to hypothesise and speculate about these things if they then go out and test and justify them empirically, but it shouldn’t be stated and treated as such certainties in the meantime when they’re not.
LikeLiked by 1 person
Hi! Would you say that this paper recently released would have any sort of implications for future predictions of CO2 release from permafrost regions?
https://www.researchgate.net/publication/334152193_Direct_observation_of_permafrost_degradation_and_rapid_soil_carbon_loss_in_tundra
Thank you once again for your work, time, and effort put into this.
LikeLike
Hi Tyler, thanks for the link, I hadn’t seen this paper yet (been on holidays). – it’s nicely done and the point of accounting for processes like compaction is sound.
What’s interesting is how most of lost carbon ends up laterally transported by water rather than emitted directly as CO2 to the atmosphere. The implication is that previous experiments observing permafrost CO2 emissions got that about right, but missed even more carbon being seeped away by water under the surface, either in dissolved or particle form. How this then affects total CO2 emissions gets complicated though – it depends on what happens to that dissolved /particulate carbon once it gets flushed out into rivers and the sea, where it can be buried and lost or respired and slightly enrich the seawater carbon stock (which might in turn affect CO2 drawdown in the ocean). As they put it, “the fate of the transported C is highly uncertain”. The caveat to all this though, as ever with experimental/observational studies, is how much this can be extrapolated across all the permafrost region, as soil types and dynamics can widely vary and this process may happen in some soil types more than others.
Overall I think the main takeaway is that more permafrost C might well be lost than I summarise in this article, but that this extra C probably won’t be directly emitted as CO2 (it may end up emitted some point later depending on seawater chemistry, or buried at sea – it’s hard to say). This paper also backs up the point about how very little of permafrost C ends up as methane during degradation, with them finding it almost negligible in this experiment.
LikeLiked by 1 person
So the whole Arctic permafrost melting 70 years early and your tweets about it (https://twitter.com/ClimateTipPoint/status/1141654407936917504?ref_src=twsrc%5Etfw%7Ctwcamp%5Eembeddedtimeline%7Ctwterm%5Eprofile%3Aclimatetippoint%7Ctwcon%5Etimelinechrome&ref_url=https%3A%2F%2Fclimatetippingpoints.info%2F2019%2F04%2F15%2Ffact-check-is-global-dimming-shielding-us-from-catastrophe%2F) don’t change anything in this article? Meaning we’ll still have modest feedback on warming (~0.5-0.6°C under high emission scenarios)? Just somewhat confused because you say melting permafrost is “bad” and a “worrying trend”, but it doesn’t contain much of the total carbon?
LikeLike
Hi Joe, yes I think the feedback calculations in this article are still about right. The worrying-ness of that early-melting article was mostly just that it goes to show how quickly parts of the Arctic are warming up because of polar amplification and how something we assumed was safe turned out not to be so much, even if it doesn’t boost the overall carbon feedback very much itself (it will a little of course, but I’d guesstimate it to probably be within the current uncertainty range). The 0.5-0.6°C (by 2100 on top of high emission rcp8p5) I collated is mostly driven by the C-rich permafrost regions, which as summarised in that twitter thread have differing thaw dynamics to the low-C / ice-rich stuff that’s unexpectedly melting. Of course that’s still a fairly significant amount, and is only modest compared to some of the bigger claims out there! Interestingly another recent but less-noticed paper (discussed in the comments above) might have bigger ramifications for my estimates, but as discussed it’s not a direct feedback on atmospheric CO2 so it gets a bit complex.
LikeLiked by 1 person
Hi, doctor McKay!
I’ve recently read this article and it’s great! This site has helped a lot with my anxiety over climate change and made me try to look for the real science amongst the different “groups” that have came up recently.
However, from reading the article and comments I’d like to know why a GWP of 86 was used for methane? I’m not a scientist, so I have some trouble finding the very near-term GWP, but I’ve heard estimates ranging from 120-150 when it comes to GWP1! As a layman I of course know very little about the physical science of climate change, but if I were to take your calculations of 0.03°c and multiply it by 150, it would be more like 4.5°c, would it not?
LikeLike
Hi John, thanks for the positive feedback! Re. GWP over very short timescales, it’s theoretically true that methane is even more powerful when it’s first released with a GWP of around 120xCO2, which would seem to make abrupt methane-induced warming much worse than estimated. But one of the big issues here is that even though the methane technically has a GWP at this point, it takes time for it to spread out and mix into the atmosphere, and during this time a significant fraction of the methane is broken down before it even gets to doing any warming. It also depends on where and when the methane is emitted, with methane only lasting around a year if it sticks near the surface but a 1000 years in the cold high atmosphere above the Arctic. And then there’s the warming lag, as once your radiatively forcing gas makes to the right part of the atmosphere it still takes several decades for this to translate into a temperature rise – much like turning the temperature up on an oven doesn’t make it hot straight away – and in the meantime some more of the methane has decayed. Because of this issue using the 20 year methane GWP for short-term impact can be used as a simplified heuristic is OK enough as a rough estimate, as it roughly takes account of the fact that not all of the emitted methane even makes it far enough to cause any warming but doesn’t entirely ignore the short-term impacts like the 100 year GWP. But GWPs are only a rough guidelines anyway, with analysing methane releases in full models the best way of establishing the likely impact of methane releases.
LikeLiked by 1 person
Thank you for the quick reply and explanation! If I’m understand this correctly, it seems like if a large and abrupt (very unlikely as you describe it!) release were to occur, it would initially be an abrupt impact on radiative forcing/energy imbalance (?), but not an abrupt temperature rise?
Really makes me wonder why certain groups and individuals are so keen on using the initial GWP.
LikeLike
Yes indeed – the analogy I use is that it’s like turning up an oven. Turning up the dial is like increasing radiative forcing, as it controls how much extra energy is entering the oven, but it still takes a little while for the heat to actually build up inside as a result. Whacking up the dial loads would trigger some rapid-ish warming, but it will still take some time to have an effect (and by which time the dial will likely be turned back down somewhat).
Re. GWP usage, it was initially introduced to enable simple back of the envelope calculations to compare the relative strength of different greenhouse gases (and therefore how much impacts cuts in each may have) for policymakers. But as with all handy simplifications, the devil is in the detail, and the thing that gets left out or confused is the implication of what timescale is picked. Picking GWP over 20y (GWP20) illustrates the power of short-lived gases but over-emphasises their long-term impact, but while using GWP100 illustrates long-term impacts better it under-emphasises their short-term power. It makes it all very easy to spin – for example some vegan pressure groups took to using GWP20 for methane to make it look like animal-agri caused the majority of climate change, but they only used GWP20 for animal-agri methane and left the other two thirds of methane emissions (including fossil fuel methane leaks, landfill, etc.) at GWP100! In the end it’s models that best account for this stuff, and when GWP estimates are used it should be provided with healthy caveats.
LikeLiked by 1 person
What do you make of this study: https://www.nature.com/articles/s41561-019-0387-6
LikeLike
Hi Joe, thanks for the link – this is the same study that I replied to Tyler on a few comments up. My short takeaway is that the estimates of the direct CO2 release to the atmosphere by permafrost that I collate in this article still stand, but that this paper shows how there can be more lateral transport of carbon by water directly in to the ocean. What happens to the carbon then is the big unresolved question – some of the organic carbon particles will likely be buried in sediments carried by the same big rivers, while the dissolved carbon will have a complex knock-on effect on ocean carbonate chemistry that would take modelling to unravel and trace the impact of. So it’s important, but doesn’t change everything!
LikeLiked by 1 person
Are wildfires included in estimates of permafrost thaw/release? I’ve read a few papers:
https://iopscience.iop.org/article/10.1088/1748-9326/aaf932
https://www.nature.com/articles/srep15865
https://www.nature.com/articles/s41467-018-05457-1
https://link.springer.com/article/10.1007/s10533-019-00560-x
It seems they do affect thaw, but sometimes it affects vegetation, active layer or the permafrost itself, and it takes several years to reach its peak subsidence. But it seems the permafrost can grow back? I’m just confused. Wildfires always happen and I never see much talk of it when it comes to permafrost thaw/release. So I’m assuming they are incorporated into the models with some variability?
I guess what I’m wondering is could they affect the estimates of methane feedback at all that you presented here for later in the century (I know obviously they affect CO2 release)?
LikeLike
Mmm, good question (and topical) – as far as I can tell the main review I used for this section doesn’t specifically mention wildfires as components of the constituent models, but I’d have to check the individual models to be sure (a few I’ve checked so far suggests not). My guess would be they either mostly don’t include it yet or only rather simply, but most permafrost models are now in the process of being upgraded and incorporated into the next big climate model round for the next IPCC report.
The linked studies do seem to converge on wildfires triggering subsidence/thermokarst growth especially in ice-rich permafrost, but that under ‘normal’ conditions the permafrost eventually recovers. [Recovery here specifically refers to the active layer thickness, which is the top layer of soil that unfreezes and refreezes each year and so is where most of the action is – increasing ALT allows more soil organic carbon to thaw and degrade each year. Recovery implies the ALT decreasing again, so the annual thaw reaching less deep into the permafrost. Historically these wildfire cycles of permafrost damage and recovery would’ve most likely balanced out across the Arctic, and so ignorable in simple models.] But they’re all quite local studies and I’m not aware of any work that extrapolates this regionally, so the big question is whether they’ll continue to recover similarly in abnormal times like ours! Ecosystem-Permafrost interactions are notoriously tricky to understand and model (with things increasing emissions often unexpectedly countered by some other component like fertilised above-surface growth), so it’s unsurprisingly confusing. Northerly boreal forest fires could even help preserve permafrost in an odd way, as dark forests boost local temperatures and so their northward expansions acts as a minor positive feedback (& so losing some forest could keep temperatures a bit lower locally) – it gets complicated!
As for impact on this post’s estimates, assuming that wildfire-permafrost interaction is currently poorly captured in models I would think that overall it would somewhat boost the total emission numbers (by expanding the thawing and slumping affected areas fasted than anticipated) but not so much the CH4/CO2 ratio (as the decay processes remain the same post-fire) – so the 0.5-0.6^oC by 2100 under high emissions estimate might be increased by some uncertain but probably smallish amount. I’ll monitor the literature and update it if it becomes clearer…
LikeLiked by 1 person
Do these numbers/predictions take into account nitrous oxide? I recently came across this: https://www.atmos-chem-phys.net/19/4257/2019/
LikeLike
These calculations are all for CO2/CH4, so don’t include N2O. It’s true that N2O is itself a potent short-lived greenhouse gas, and recent studies suggest permafrost emits more of it both in general and during thawing than anticipated. However, it’s also not very well studied, has complex interactions with ecosystem changes (more be made, but more may also be broken down by extra bugs & veg), and has a lot of uncertainties on what even the normal baseline emissions are, let alone recent increases. Overall though the global contribution of N2O to warming so far has been fairly well constrained as having a small but not insignificant impact (with a radiative forcing of ~0.17 W/m^2, compared to net total of ~2.3 W/m^2, so about 7% – https://climatetippingpoints.files.wordpress.com/2019/04/ipcc_ar5_rf_aerosol.png?w=1140). Future model projections (e.g. http://dx.doi.org/10.1038/nature10176) suggest that N2O emissions will indeed increase with warming and biosphere feedbacks, which will somewhat reduce the expected net increase in land ecosystem carbon sink. But this is very uncertain and fast-moving research area, so projections may well change!
LikeLiked by 1 person
I just wanted to take a minute and thank you for putting this blog together. Like I’m sure a lot of people researching the reality of climate change I’ve come across lots of (seemingly dodgy) claims of unavoidable and often imminent human extinction and other dooms usually supposedly due to impending massive arctic methane releases (and/or what appear to be overinflated estimates of ECS and ESS, and/or excessive rates of upcoming warming, and/or extreme amounts of warming locked in, and/or this, that, or the other thing). Your posts addressing many of these claims have certainly helped to put my mind at ease. Scientists like you and the team at ClimateFeedback are doing a great and under-recognized service explaining what the science actually says, not what people on Twitter or random blogs and media outlets often misinterpret it to say. The reality is definitely plenty scary enough; there’s no need to exaggerate and suggest we’re certain to all die this century (especially not when there’s a lot of work that has to be done addressing this very real crisis, and we need all hands on deck if we’re to have a shot).
I was wondering, however, if you’re likely to have time to finish some of the other tipping points fact-checks. For instance, a family member was recently suggesting that we were likely to cause another End-Permian-level mass extinction event from ongoing emissions; for his (and my!) peace of mind it’d be great to be able to point him to a fact-check (or at least some good sources) explaining why that’s unlikely. Regardless, thanks again, and please keep up the great work!
LikeLike
Hi Connor, thanks for the positive feedback, it’s good to hear! The gist that the climate challenge is already serious enough to demand rapid radical action without the need for hyperbolic runaway warming / near-term extinction scenarios is exactly what I’m trying to get across. There has been a bit of a summer blogging hiatus (mostly because of having to double-down on work for a couple of conferences and paper deadlines, plus some holiday), but I’m getting back to writing some more posts now – in fact I just published a new one today! I’ve rejigged the posting order though, as I’ve noticed two big framings (2 degrees as a global tipping point and IPCC models downplaying real warming) coming up a lot that needed attending to first. But after that I’m planning to get on to ancient mass extinctions, as I’ve found that’s a source of a lot of confusion too. I’ll definitely talk about the end-Permian in that, including elaborating more on the points in this twitter discussion here: https://twitter.com/saunatonttu3/status/1172562982531993601.
LikeLiked by 1 person
Hello Dr. McKay! Apologies for bothering you with more silly questions, but I was hoping to get your input on a couple of points (and, as they’re both Arctic related, a bit long, and appropriate for general consumption, it seemed like this might be the best place to ask them).
First, I’m sure you’re being (or soon will be) bombarded with questions about the new NOAA Arctic report, so I’m sorry I have to ask another one. After the news coverage of the report broke yesterday I’ve been seeing a lot of “We’re doomed”-type attitudes popping up in my various circles, and so have been trying to push back on them as best I can (I’ve certainly been dropping lots of links to this fact-check). In your opinion, is this the right general framing for what the report actually says?:
1) This isn’t really surprising or unexpected; it’s hardly a shock that permafrost thaws when it warms and that in turn leads to carbon release. Also, there’s not much, at least in terms of when the release has started and the amount being released, that’s really out of line with up-to-date research, such as the Turetsky et al. comment you cite in the fact-check, with the possible exception (based on Dr. Turetsky’s Twitter feed) that winter carbon respiration is a bit higher than initially expected.
2) It’s definitely not good that the permafrost has probably become a net emitter, as it’s yet another challenge to decarbonization and keeping overall temperatures as low as possible, but it isn’t the end of the world either – the total net carbon release is probably, at worst, about 0.6 Gt of carbon a year right now, and compared to the amount (>10 Gt a year) we’re emitting from fossil fuel burning we should really be focusing more on the big amount of carbon release we can directly control rather than the small amount we can’t.
3) There’s nothing that implies that this is “past the point of no return”, “going to start thawing exponentially”, or “going to be a carbon or methane bomb”. The less warming we cause directly from our own carbon emissions the less warming we’ll add on to that from the effects of permafrost thaw; permafrost thaw is mainly a feedback that takes centuries to fully play out and likely won’t accelerate to very high levels unless we decide to burn all the carbon for the heck of it; and even though a lot of CO2 and some methane will be released no matter what we do it’s, again, more of a nasty bump to warming than some kind of civilization-ending doom bomb.
I’m hoping that’s the right way of looking at the permafrost situation! Please correct me if it isn’t.
Second, I’m also seeing a lot of concern about Arctic sea ice (and have been linking to *that* fact-check as well). It seems most of this is originating with a couple of Twitter accounts (while I’m sure a certain French gentleman with 35,000 followers means well, it does strike me he could be doing a lot more good were he tweeting out the actual facts rather than misinformation…), encouraged by the recent tipping points comment in Nature and a paper Michael Mann worked on. Just to clarify, again so I can try to help people understand what’s really going on: is there anything that indicates a) that Arctic sea ice is past a point of no return (my understanding is ‘no’, and actually even if it did all melt it would eventually reform if we somehow brought temperatures down again); b) that the first ice-free summer will come sooner than expected (everything I’ve read, at least that doesn’t reference Paul Beckwith, still points to it first happening roughly in the next couple of decades and only a while after that occurring consistently); or c) that previous estimates of the temperature and other impacts from reduced sea ice have been underestimated? (again, despite some very ‘out-there’ claims that have been floating around, the science still seems to be as you outline it in the earlier fact-check – a relatively small bump to warming with the loss of albedo, maybe some marginally weirder weather, and no methane bomb.)
Sorry for the long comment, but thanks as always for the outreach you’re doing! I’m hoping that I can help a few people veering close to doomism recognize that despite some real and unpleasant news coming from the Arctic, it’s definitely not “all over”, and that there’s a lot of work we should be doing.
LikeLike
Hi Connor, apologies for the slow reply – a very busy end of term for me and some other events mean that I’m a bit behind on various replies, and haven’t had a chance to do a full breakdown of the NOAA Arctic report card yet either. But yes, that summary’s spot on – permafrost carbon release is indeed not good but also not unexpected, and is still far less than annual anthropogenic emissions as you point out. There does appear to be more winter CO2 emissions than previously expected (e.g. this recent study: http://dx.doi.org/10.1038/s41558-019-0592-8) which may make permafrost a net C source , but it’s not been a sudden huge jump (more of a late recognition of the fact) and there’s a fair bit of uncertainty on these numbers too. Current research on permafrost don’t support there being a big widespread tipping point until 5+C of global warming either, although there can be localised tipping in the meantime (e.g. when a particular patch thaws enough to generate enough decomposition heat to drive its own thawing, or cracks enough to suddenly drain the topsoil [http://dx.doi.org/10.1038/s41558-019-0614-6], but both of these are mostly localised phenomena).
Re. Arctic sea ice, there are indeed a lot of people hyping it as *the* tipping point that triggers wider doom, but I’m still of the opinion that it’s a far better example of a positive amplifying feedback rather than a major tipping point as there’s not such a clear mechanism for it becoming self-perpetuating or irreversible (i.e. summer sea ice could disappear with 2-3C of global warming, but as you suggest if there was hypothetically enough C drawdown to bring temps back to 1.5C there’s no reason that summer sea ice could start reforming). Current projections make 2030-2060 the most likely time range for first summer sea ice disappearance, but there’s so much additional natural inter-annual to decadal variability on it that it’s really hard to be sure. There is a smaller chance that this variability could well cause a first occurrence in the 2020s, but even if it did there’s no evidence that it would cause a sudden warming spike as discussed. This recent Nature collection (https://www.nature.com/collections/bfihgidbhc?proof=true&draft=collection) brings together some of the research on whether it would have a big impact on mid-latitude weather, and is a very mixed bag either way (let me know if there are any closed articles you want access to in particular and I can share!). As an aside, I’ve been interacting with Arctic sea ice-doomers since around 2012 during my PhD (when some said with certainty that 2016 would be the BOE & agriculture/civ would collapse in 2018), and I don’t doubt they’ll carry on projecting that the BOE/collapse will happen in a few years time for as long as it takes for the BOE to finally happen (and then say told you so)!
LikeLiked by 1 person
Hello (again!)
I feel bad for running to you as soon as a new idea or study comes about, but I think you’re about as good a resource as I can find for second opinions on these sorts of tipping points; thanks for your dedication to this site!
I’ve recently seen this article from the University of Alaska Fairbanks, and I was curious to not see a paper or study listed among the publication; it seems to be a summary of Louise Farquharson’s presentation at the AGU meeting over in San Francisco, on her work with Vladimir Romanovsky in Kougarok, Alaska at thawing talik sites… in particular, how these taliks mean that permafrost may cross its permanent tipping point faster than understood now, changing global carbon emission calculations and putting Alaskan permafrost into obligatory melt at 2035, regardless what changes in anthropogenic emissions. https://news.uaf.edu/the-arctics-grand-reveal/
I’ve seen Romanovsky in previous news reports and papers, but this is the first time I’ve heard of Dr. Farquharson. I’m not as familiar with the idea of permafrost thawing on its own volition by 2035 either (unless I’ve skimmed over that fact in one of your summaries; if I have, my apologies).
I’m confused as to why I’m not finding any information on this; no paper, no study, no mention of a paper in the works, nothing. Am I missing something in the tipping points literature, or is this something new?
Thank you!
LikeLike
Hi Mitchell, Apologies for the slow reply, was pretty busy pre- & post-christmas and am only just getting back the blog! Thanks for the link, I hadn’t seen this yet either… My guess is that as it was only recently presented at AGU they either hadn’t submitted it yet (sometimes it can take months from conference to submission, despite our best efforts!), or it’s already in but still under review. I’ll have to keep an eye out for it though, as it seems like a pretty legit-sounding tipping point mechanism. I’m assuming the 2035 date is for their study region of Interior Alaska though, rather than the whole of the Arctic Permafrost (and will probably also depend on emissions scenario). As for Dr. Farquharson, I believe she’s a Postdoc who was involved in this article last year: https://www.theguardian.com/environment/2019/jun/18/arctic-permafrost-canada-science-climate-crisis, so is legit (I found her on twitter too, which also has some photos from her AGU talk: https://twitter.com/lm_farquharson?lang=en). Back last summer I did a thread on that study and how the social media reaction got the implications a bit wrong: https://twitter.com/ClimateTipPoint/status/1141279000473559040, and it turns out she also said similar things about it as well: https://twitter.com/LM_Farquharson/status/1138868163892826112. So, interesting stuff, and when the paper comes out I’ll have to delve into it to find out more!
LikeLiked by 1 person
Hi David, very good post. It seems that the evidence so far doesn’t support the theory about a methane bomb about to explode, which is kind of relieving. However, I was wondering if this scenario would still be possible if people decided to extract natural gas from methane hydrates and there was some kind of accident (maybe a leak or something like that) that could end up releasing methane to the atmosphere. I know there are already some leaks of methane due to anthropogenic causes, but so far these leaks have not caused a global catastrophic temperature increase in a matter of years. I also haven’t seen much on this topic, and most of the news articles that talk about methane releases due to extracting natural gas from methane clathrates are from the early 2010s, when there weren’t many studies pointing to the lack of support for the methane bomb scenario. Do you think that this catastrophic releases would still be possible if there was any accident while extracting natural gas? (also I think that currently it is not extracted from hydrate reservoirs in a commercial scale, but maybe it will become more viable in the next decades, hence my concerns).
Hope you are well, and I hope to read more of your posts in the future! They’re really good and well explained!
LikeLike
Hi Alex, good question – there have been proposals to mine methane hydrates for natural gas extraction, but as far as I know there’s not been many actual trials or direct research on potential side effects. I certainly think that methane leaks would probably be an issue from attempting such mining (as well as the even bigger issue of opening up a pretty large additional fossil fuel reserve to burn and locking in high-carbon infrastructure), but I think it’d be mostly localised and act gradually on a global scale (much like current gas-extraction leaks) rather than trigger a sudden widespread release. I wouldn’t rule out the possibility of say destabilising a particular clathrate field and causing a large local release, but the potential release from a given field would likely be smallish on a global level (probably on a Megatonne rather than Gigatonne scale), and I don’t think it’d be able to have a domino effect on other fields. But I’m not aware of good research on this, so that’s just my guess! Of course, given we already have more than enough fossil fuel to burn to cause climate chaos my personal position is that there should be a moratorium on clathrate mining anyway!
LikeLiked by 1 person
Thank you so much for your reply, I also thought that it would most likely cause some leaks like the current ones from gas-extraction activities (which is already bad), rather than triggering a large release that increases temperatures around 5ºC. I did a quick search to check if there are any recent studies about it, but I didn’t find anything talking specifically about this. Also, as far as I’m concerned, currently it is not yet economically viable to extract natural gas from hydrates on a comercial scale and it would likely take some decades for it to be, especially when renewables are cheaper than ever (and I doubt extracting natural gas from hydrates will become even cheaper than renewables, although I’m not an expert so maybe I’m wrong). Anyway, having yet another source of fossil fuel to burn is already worrying indeed!
Just one last thing, on the “Short Shelf Life” section, you write “But as we’ve explained, the evidence for such a large reservoir of free methane is shaky, and no justification is given for 3-5% of the ESAS seafloor simultaneously collapsing”. On a hypothetical scenario, what could cause the ESAS seafloor to simultaneously collapse? I doubt digging for natural gas in clathrates would be reason enough to cause this, but as I said I’m not an expert on this so I might be making wrong guesses! Anyway I’d like to know what hypothetical major event would be enough to make a portion of the seafloor to suddently collapse, or if it is even possible.
Also thanks for writing those detailed answers, they really help a lot!
LikeLike
I guess it’d have to be something like a big earthquake causing a big tsunami-inducing slump of the continental slope, a bit like the Storegga slide 8000 years ago after the last deglaciation (https://en.wikipedia.org/wiki/Storegga_Slide). However, even an event of this size would affect only a part of the ESAS, and although the Storegga slide possibly involved clathrates there’s no record of abrupt warming around then either (but this might just reflect far lower clathrate reserves to start with, so a few % releasing wouldn’t be so noticeable).
LikeLiked by 1 person
Thanks, David! That makes a lot of sense. I’ll try to keep an eye on further research! 😉
LikeLike
Hello David!
This is a great article, and a really useful website. I have just a couple of questions.
First, are you planning to update this article with reference to the recent Arctic methane leak report?
https://www.theguardian.com/environment/2020/jul/22/first-active-leak-of-sea-bed-methane-discovered-in-antarctica
I see that you have already tweeted about it, but further update here would be nice, considering the influence of the misleading claims about it.
Second, can we have a separate fact check about the supposed ocean phytoplankton tipping point? I occasionally hear claims that the growth in temperatures and/or ocean acidification is already reducing the prevalence of phytoplankton, and that these effects, possibly combined with those of plastic and other pollution, will wipe them out or at least halve them within these next few decades, as well as that there is going to be a corresponding bloom in the hydrogen sulfide bacteria, and long story short, basically everyone dies. It would be nice to see something about the likelihood of such a scenario.
LikeLike
Hi Nick, glad it’s been useful, and good idea re. mentioning the leak. The plankton thing is on my list too (as part of a post on past mass extinctions, and how this one isn’t like the Permian-Triassic with all the sulphide), and also happens to be I’ve been working on recently for the day-job ( https://doi.org/10.5194/esd-2020-41). Long-story short: warming & OA are indeed likely to have a negative impact on plankton, shifting ecosystems to smaller species and reducing their complexity and carbon sequestration, but nowhere near their total extinction – plankton have the advantage of being able to migrate with warming & acidification (unlike coral), and have been through some sticky patches before. The sulphide thing would only happen if ocean circulation stopped for a long time too, which even if the Atlantic overturning collapsed due to warming would probably not be enough. And even if plankton did die-off for some reason, it’d take millions of years for oxygen to fall too as the normal inflow is so small relative to how much is already in the atmosphere. Blogging’s been a bit slow this year, but I’m hoping to get the mass-extinction/plankton post done next!
LikeLiked by 1 person
Hi David!
Thank you for this response, and for linking to your group’s latest study.
I guess that the “long story short” is reassuring, although as someone with a hunger for context and long stories, I am eagerly awaiting the plankton post.
In the meantime, I have a couple more questions that accumulated over the past few days: some in regards to plankton, while others would probably befit a separate post next.
1) What do you make of this study that predicted an overall growth in phytoplankton in response to global warming (at least, to an extent)? https://www.nature.com/articles/s41561-019-0524-2 Considering that it was published in January, its data may have had already been accounted by your latest study, but I suppose it’s not a bad thing to ask, or to include a discussion of that study in the upcoming plankton post.
2) On the contrary, what is your take on the last year’s study that found plastic leachates had impaired the growth of at least one common phytoplankton type? https://www.nature.com/articles/s42003-019-0410-x
I know that these impacts are often highly dose-dependent, but I have no idea how likely are any of the concentrations they tested to accumulate in the actual marine (or freshwater aquatic) environments, whether now, or in the future.
I would really hope that any eventual plankton post would both discuss that particular study about leachates, and also several recent studies about the rate of accumulation of (micro)plastics:
I) Re-evaluated growth in plastic pollution entering oceans. https://www.theguardian.com/environment/2020/jul/23/plastic-waste-entering-oceans-triple-20-years-research
II) New estimates on the car tyre microplastic pollution. https://www.theguardian.com/environment/2020/jul/14/car-tyres-are-major-source-of-ocean-microplastics-study
III) The fresh-off-the-presses finding that crustaceans can biologically fragment microplastic to nanoplastic in less than a week. https://www.theguardian.com/environment/2020/jul/30/small-crustacean-can-fragment-microplastics-in-four-days-study-finds
At this rate, I suspect more such research will appear even before you complete the post, but nevertheless, it’s a (horrifyingly) fascinating subject that deserves complex and up-to-date discussion.
3) In regards to the Arctic warming, one paper claiming that the current rates are underestimated was published just yesterday. https://www.nature.com/articles/s41558-020-0860-7#Sec9
I understand it is not good news, but it’s unclear just how bad these news are, so it would again be interesting to see this discussed in one of your Arctic entries.
4) In addition, there has been a paper comparing recent concentrations to the Mid Miocene Climatic Optimum, and suggesting it could result in the temperature rises of +7 degrees.
https://agupubs.onlinelibrary.wiley.com/doi/abs/10.1029/2020PA003900
It’s from May, so I assume it would have had already been looked at (and discarded) by the recent comprehensive report that estimated the CO2 doubling sensitivity at 2,6 and 3,9C, but I would still appreciate an explanation in regards to this paper, and perhaps an update on the “Is 2C+ already locked in?” entry. (And perhaps, some older entries could be updated with references to the climate sensitivity study?)
5) This is something which I feel warrants a separate post, as it would essentially constitute a separate tipping point in regards to the forests/flora in general.
Basically, there is a confluence of these factors:
I) The possibility of the savannah-zation of the Amazon. https://www.theguardian.com/environment/2019/oct/23/amazon-rainforest-close-to-irreversible-tipping-point
2) Trees in the European forests suffering and dying from heat stress, and recovering slower than usual. https://www.eurekalert.org/pub_releases/2020-07/uob-hst071620.php
2,5) Phenomena like the one above had already led to earlier headlines claiming that most trees alive today will be dead in 40 years. http://www.rapidshift.net/most-trees-alive-today-wont-be-able-to-survive-in-the-climate-expected-in-40-years/
3) The decline and potential extinction of the bees and the other pollinating insects (so well-known that links are unnecessary at this point) leading to knock-on declines and extinctions of the flora they pollinate.
3.5) I also heard a suggestion that plants becoming larger yet less nutritious per-gram as the CO2 concentrations grow is a problem not only for future food yields, but also for their very own pollinators. Is there anything to this effect that could constitute a “tipping point”?
4) The decline of some ocean kelp forests. https://www.sydney.edu.au/news-opinion/news/2019/02/06/underwater-forests-threatened-by-future-climate-change.html (Something your ocean sink study had likely looked at already, and which is offset by at least some seaweed growth elsewhere, AFAIR, but still an worthwhile subject to discuss, imo.)
5) The effects of microplastics on the terrestrial plants. Some studies suggest negative effects on their growth and photosynthesis, or on the surrounding biosphere (earthworms)
https://pubmed.ncbi.nlm.nih.gov/31009929/
https://pubmed.ncbi.nlm.nih.gov/31854836/
https://pubmed.ncbi.nlm.nih.gov/31918148/
But a different study suggests that these negative effects only appear at unrealistic concentrations (Though, given point 2, I am not sure if they will remain unrealistic for long). https://www.sciencedirect.com/science/article/pii/S004896971834539X
Altogether, I think there enough material for a blog post on whether there is going to be a forest/flora die-off tipping point that will push us over the edge.
Hope I haven’t overwhelmed you with all of this! It’s a heavy, scary subject, and people are prone to shut off emotionally and turn to denial or doomerism in response to all these undoubtedly dispiring findings. You appear to be nearly the only scientist active online who is willing to soberly engage with the implications of this data, rather than ignoring it or turning to either extreme!
Best of luck with your work, and with updating this blog!
LikeLike
It depends on a phytoplankton species, long story short – some species can be adapted to more acidic and warmer enviroment, use fever nutrients, and consume more carbon, there is still a lot of research need to be done. Here is an article from EOS https://eos.org/articles/the-ocean-is-still-sucking-up-carbon-maybe-more-than-we-think
LikeLike
Hello, I’ve accidentally fallen down a rabbit hole about all this and it’s terrifying me. I’ve recently found this article “https://www.sciencedaily.com/releases/2020/03/200330093427.htm” and I was wondering if this changes any of what you’ve said? Does this mean there was a massive methane release after the last quick warming, so it could happen again? Are the good sources for debunking catastrophic scenarios, like Carolyn Ruppel, still valid after this? The thing that’s upsetting me most is that I don’t know what “instant” means – could you give any insight? Sorry for all the questions, and thank you for this blog, because I have limited scientific education and a massive propensity to worry about doomsday stuff.
LikeLike
Hi Alice, thanks for linking to that study, I hadn’t come across it yet. I don’t think it changes too much though, as the signal this study shows (sulphur vs oxygen isotope anomalies) occurs as a result of microbes eating up released methane, preventing much of it from getting to the atmosphere. We also already know from ice cores that methane increased during deglaciation but not massively, ruling out any massive abrupt releases, and that warming was dominated by other factors (like CO2 and ice albedo). Another issue is that a geologists definition of instant or abrupt is often actually a long-time by normal standards – for example, climate change across the last deglaciation or some past warming events taking over a thousand years is still considered abrupt! So overall what this study shows is that past warming (along with changing sea level pressure) did likely destabilise methane hydrates, but it still took hundreds to thousands of years and much of it was consumed by microbes in the process. Glad the blog has been helpful, and feel free to ask more questions!
LikeLiked by 1 person
Thank you so much for the very helpful reply – I’ve got another one for you, sorry! I found this really recent article – https://www.nature.com/articles/s41467-020-17289-z – and it just worried me a bit, because I thought the non-“doomsday” consensus was that the hydrates could start melting from human-caused climate change in the future but they weren’t doing it yet, but this seems to say it’s already noticeably happening on like a fifty year timescale. Is this something to be really worried about? Or is your conclusion still the same? Thank you!
LikeLike
Hi Alice – sorry for not replying to this sooner, I’ve had a hectic summer & autumn applying for grants and getting ready for moving countries and haven’t had enough time to keep on top of blogging and questions. The short answer to this is that some methane seeping from hydrates is normal, and that they have often being going on for millennia since the end of the last ice age glacial. In this case the presence of authigenic carbonates (a sort of limestone crust that gradually grows at the seep site) indicates it’s quite an old seep – in their words: “high gas flux over timescales of at least thousands of years at this location”. On top of that, the bubbles only make it part way through the ocean, meaning they dissolve and don’t make it to the atmosphere. They do find some evidence that the edge of the stability zone may now be moving due to the past ~50 years of warming, but only marginally, and it’ll take a long time for that heat to make its way through to where the bulk of the methane lies. Of course this isn’t ideal, but it still fits in fairly well with our current picture of global methane hydrate behaviour.
LikeLiked by 1 person
What’s your opion on the leak in the Laptev sea
LikeLike