

Tipping points can trigger rapid shifts to a new normal state that can seemingly come from out of the blue. There would appear to be no warning of these impending shifts, and little time to prepare for the consequences. But it may be possible to spot these shifts in advance if we watch out for some subtle changes.
What are these subtle changes like? Imagine a ball sitting in a valley being jostled by random small knocks (either by external shocks to the system or internal “noise”). When the valley sides are steep and it’s difficult to escape, the ball will wobble a bit but will stay fairly close to the valley bottom – in this valley the ball can be said to be highly “resilient” to knocks. However, if the valley has very shallow sides and is easy to escape from, even small pushes can cause the ball to wobble around the valley a lot and the ball will take longer to return to normal after a knock. A big push can even knock the ball over the ridge and in to another valley. The ball is therefore less resilient in this valley and can more easily hit a tipping point beyond which it rapidly shifts to a new normal state (i.e. the next valley over).
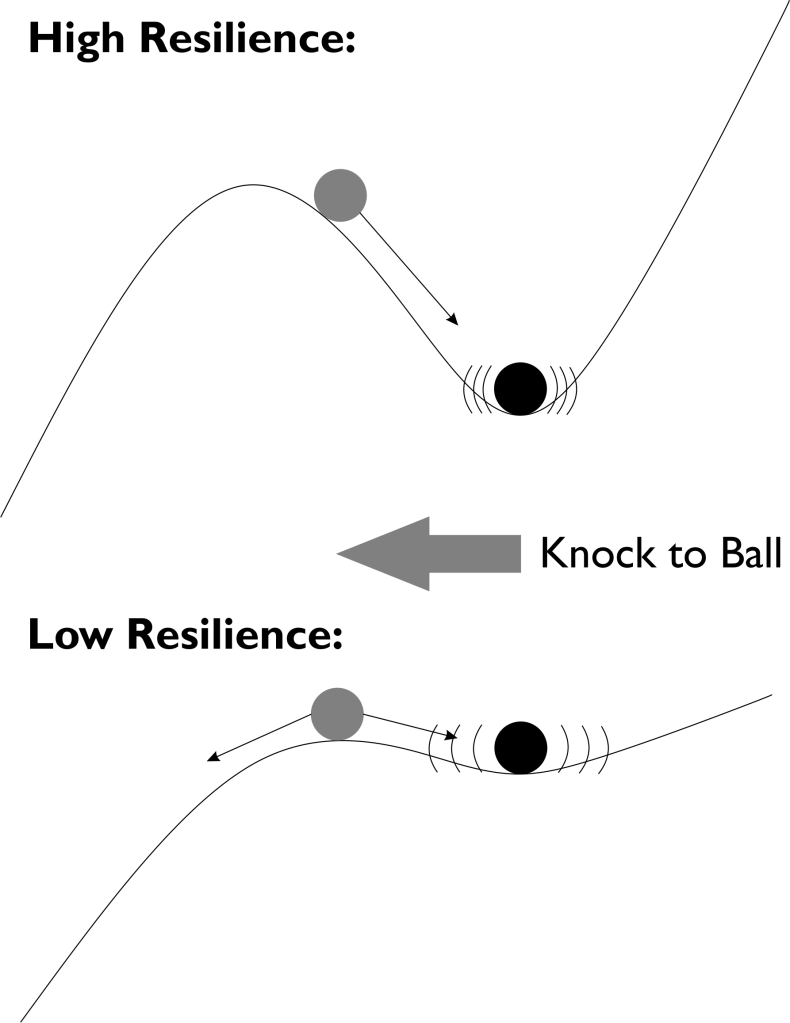
Real-world systems like the Earth’s climate work in a similar way. A system in a more resilient state should ‘wobble’ less and recover faster from small knocks than one in a less resilient state. A system approaching a tipping point becomes less resilient to knocks (like the hills either side of the valley gradually flattening). The system’s state becomes more erratic and takes longer to recover from small knocks: in the example of Earth’s climate, you might see increasing variance in temperature before a tipping point. You can think of it like a spinning top – it’s stable for a while, but as it slows down it starts wobbling more and more and eventually tips over (see gif below).

This process is known as “Critical Slowing Down”, and can be spotted using statistical analysis of data. Critical Slowing Down can be spotted as an increase in the tendency of the system’s current state to be similar to its preceding states (known as “autocorrelation”, and indicating slower recovery from knocks). It can also be seen in increased variability in the system (indicating knocks are affecting the system more).
Evidence of Crticial Slowing Down can be seen in ancient climate records and in climate models. Several examples have been found of increased autocorrelation and variance in geological data prior to an abrupt climate shift, including at the end of Ice Age glacial periods and at the Eocene-Oligocene Transition (~34 million years ago, when Antarctica first got its massive ice sheet). However, reliably detecting these signals is challenging work and both false alarms and missed alarms are possible, so research to improve this technique’s accuracy is still ongoing.
By studying these ancient climate records and improving our early warning detection methods we hope to be able to spot similar signals in the climate today, which would give us early warnings of climate tipping points before anthropogenic climate change triggers them.
Spinning Top Image by carrotmadman6 from Mauritius (DSCN8281) [CC BY 2.0 (http://creativecommons.org/licenses/by/2.0)%5D, via Wikimedia Commons

1 Comment