The Intergovernmental Panel on Climate Change (IPCC) released the first part of its sixth assessment report (AR6) in August. Much of the media attention focused on what the new report had to say about tipping points in particular, especially following an earlier leak of a draft of the report’s second part.
Now delegates are gathering in Glasgow for the ‘COP26‘ UN climate talks, where the aim is to ramp up global policy commitments to keep the Paris Agreement target of 1.5°C alive – a target seen as increasingly important for avoiding climate tipping points.
In this article we’ll focus in on what the new report has to say so far about climate tipping points and feedbacks, and what they mean for climate action.
The IPCC reporting
Every six to seven years the IPCC compiles a report which brings together and assesses all of the advances in climate science in that time on behalf of the UN’s member states. The report comes in several parts, the first on the physical science basis (by Working Group 1) which has the most on climate tipping points, and parts two and three on impacts & adaptation and mitigation. This is the biggest update from the IPCC since its one-off special reports on 1.5°C, land use, and the ocean & cryosphere in 2018 and 2019 and the last big report (AR5) in 2013-14, so AR6 brings together a powerful summary of recent climate science.
The headline conclusions of the first part of AR6 are simple: human-caused climate change is unequivocal, its size and rate is unprecedented, and it’s already causing weather and climate extremes across every inhabited region.

For the future, it projects that the Paris Agreement limits of 1.5°C and 2°C will be passed in the 2030s and 2050s if emissions don’t immediately peak and rapidly decline over the next few decades. If emissions aren’t stopped we can expect even worse weather extremes, greater sea level rise, weakening natural carbon sinks, and a small but real risk of triggering low-probability high-impact events like tipping points.

Earlier leaks from the draft report triggered media stories about the IPCC making bolder warnings about climate tipping points. The stories mention that a dozen different climate tipping points have been identified by the IPCC, but these 12 tipping points were not clarified at first as the leaks were from the report’s at that point unpublished draft second part (a specific list of 12 climate tipping points did not feature in the second part when it was finally published, so may have been dropped in the meantime). The first part still featured plenty of discussion of climate tipping points and feedbacks though, which we’ll focus on next, before summarising what the second and third parts of the report had to say on tipping points at the end.
Carbon Cycle Feedbacks
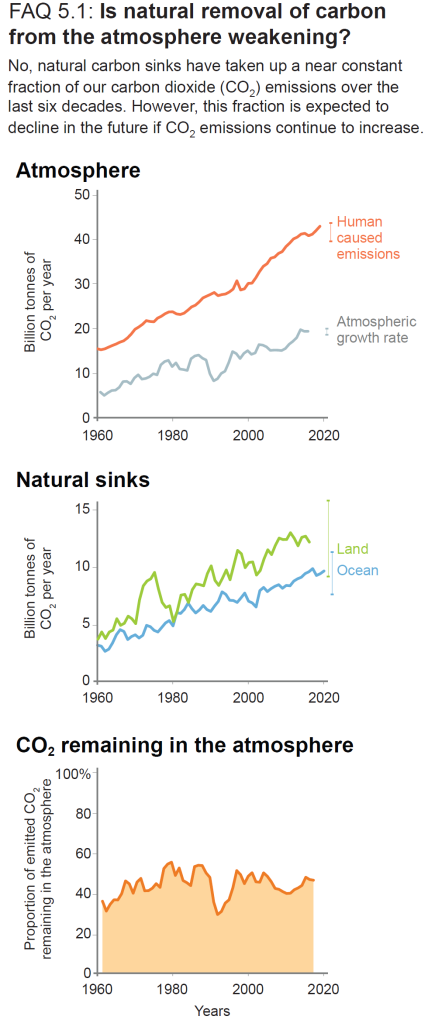
First of all, let’s look at feedbacks, in particular ones that could lead to extra carbon emissions from nature (known as ‘carbon cycle feedbacks’).
Key carbon cycle feedbacks include the weakening of the natural carbon sinks that currently take up around half of humanity’s emissions, and emissions from permafrost thawing in response to warming. These feedbacks can reduce the amount of carbon that can be emitted by humans before the 1.5-2°C Paris Agreement limits are reached – the ‘carbon budget‘ – and amplify the warming we’d expect for a given emission scenario.
Unlike what is sometimes claimed or implied, IPCC projections do in fact take account of carbon cycle feedbacks, albeit often in a simplified way. As explained in this Carbon Brief analysis, in order to assess remaining carbon budgets, in previous reports the IPCC took future climate projections of climate models without carbon cycle feedbacks and then added a best-estimate of these feedbacks back on (based on models that include these feedbacks).
For example, in the IPCC’s 2018 Special Report on 1.5°C, the carbon budget was arbitrarily reduced by 100 gigatonnes of CO₂ (GtCO₂, i.e. a billion tonnes of carbon dioxide) to account for unquantified feedbacks. This was a reasonable approximation, but a more recent analysis showed that a fuller representation of carbon cycle uncertainties expanded the range of possible warming for a given emission scenario, with this range skewing towards extra warming. If carbon cycle feedbacks end up at the high end then warming would be more than expected, which means there would be less carbon budget available for staying within 1.5°C.
In AR6 the IPCC now takes a more robust approach to account for the impact of carbon cycle feedbacks on the carbon budget. Joeri Rogelj, a lead scientist on the carbon budgeting process, explained that: “Taking into account not only permafrost thaw, but also a host of other biogeochemical and atmospheric feedbacks… remaining carbon budgets have to be reduced by 26 ± 97 GtCO₂ per °C of additional warming.” This is based on the figure below, with carbon cycle feedbacks shown in panel (b) having a negative (i.e. dampening) effect on climate change.
In combination with other improvements, the end result is that AR6 carbon budgets are fairly unchanged from 2018, indicating that the previous feedback simplification wasn’t too far off. Feedback estimates are also fairly unchanged between the previous two model generations (called CMIP5 & CMIP6 – hatched vs. solid bars in panel b below), with more recent land vegetation models tending to give slightly weaker negative feedbacks than before.

As for the ‘core’ emission scenario and warming projections (shown in the future projection graphs earlier), AR6 still uses models without carbon cycle feedbacks but concludes that, although the combined effects of all feedbacks is to amplify the warming, this does not strongly affect the AR6 projections of warming this century.
Much of the carbon cycle feedback is determined by the response of natural carbon sinks to both CO₂ and to warming. The AR6 figures above (FAQ5.1) and below show how natural carbon sinks continue to take up a large proportion of the carbon released by humans, but the proportion shrinks with more global warming. So far natural carbon sinks have taken up over half (~54% in the 2010s) of anthropogenic emissions, with ~23% dissolving in to the ocean, causing acidification, and ~31% taken up by extra plant growth on land.

If we stopped emissions now these carbon sinks would continue to draw down emissions for a while, reaching ~70% of human emissions in the Paris-compliant low emission ‘SSP1-1.9’ scenario (on the left). But with higher emissions, carbon sinks start to struggle – the ocean can dissolve less CO₂ at higher temperatures, and droughts and excess tropical warmth limit extra plant growth – so the proportion of human emissions they take up starts to fall, reaching only ~38-44% in the high emission scenarios on the right. This reduces the carbon budget available for a given warming level, and so acts like a positive/amplifying feedback.
Overall then, the picture on natural carbon sinks and feedbacks has remained similar in AR6, with updates mostly being some more constraints on likely future carbon sink uptake and to lay it out more clearly. But what about tipping points and the possibility of “low-impact high-probability” events?
Tipping Points

Permafrost & methane
Permafrost soils contain a huge amount of carbon, and as they thaw with warming some of this carbon will degrade and be released as CO₂ and methane (CH₄). This makes permafrost both a key carbon cycle feedback and part of the cryosphere, but as it stores so much carbon and has the potential to become a tipping point it deserves special attention.

In contrast to AR5, a few more Earth system models used by AR6 now include some (but not all) permafrost thaw processes, but as not all models include them AR6’s permafrost thaw projections are largely based on separate permafrost-enabled land surface models.
AR6 projects that for each degree of global warming humans cause, permafrost will likely emit around an additional 18 gigatonnes of carbon (GtC) by 2100 (with an uncertainty range from 3 to 41 GtC) in the form of CO₂, reaching a total release of ~240 GtC of CO₂ in the 21st century under a high emission scenario. For context, human CO₂ emissions are currently around 10 GtC a year so permafrost emissions represent an extra few years’ worth of current emissions per degree of warming, and ~24 years’ worth in an extreme case. Methane – which is a rarer but more powerful greenhouse gas than CO₂ – boosts the effect of these emissions by 3 GtC or so. However, abrupt thaw processes are currently poorly constrained and don’t feature in most models, and could boost emissions further.
Clathrates (also known as methane hydrates) are also mentioned, and are assigned a “very low” probability of tipping and a very likely small release of methane in the 21st century (a likely maximum of 20ppb). This is because it takes so long for excess heat from global warming to reach the seafloor and then travel through the heat-resistant sediment below, and clathrates themselves have self-stabilising mechanisms. Instead, clathrates are likely to act as a very long-term positive feedback on whatever level temperatures stabilise at, slowly releasing additional methane to the ocean and atmosphere. This is likely what occurred in the Earth’s past, with clathrates likely acting as a feedback maintaining the 5°C of warming during the ‘PETM’ event 55 million years ago.

Forest Dieback
The Amazon rainforest generates up to a third of its rainfall recycling the moisture from rainfall in to more rainfall further inland, helping to sustain itself in areas that would otherwise be too dry to support a rainforest. This means that if rainforest downwind of these otherwise dry areas is lost (as a result of deforestation or climate change-induced drought or wildfires) then these drier areas can reach a tipping point and ‘die back’ to a grassy savannah state instead. However, only some of the models used by the IPCC show this as a dramatic instability, and so AR6 gives a low likelihood for Amazon dieback happening this century. If all tropical rainforests around the world were to die back, though, it’d release up to 200 GtC as CO₂, which would add an extra ~0.3°C of warming; previous estimates suggest a maximum release by the Amazon of 53-70 GtC, leading to ~0.1-0.2°C warming.
Boreal forests – the dense conifer forests around the edge of the Arctic, also known as the ‘Taiga’ – may also be vulnerable to dieback in places, with drought, climate-induced beetle infestations, and wildfire creating abrupt dieback tipping points in some models. This doesn’t happen in all models though, with some newer models being less sensitive to dieback processes (although these models still lack key ecosystem dynamics, and so may be underestimating this sensitivity). As a result AR6 gives boreal dieback a low likelihood in the 21st century as well, and gives a maximum carbon release of 27 GtC that’d likely be partly counterbalanced by boreal forest expansion in to the warming Arctic tundra.
Ice sheets & sea ice

Several parts of the Earth’s cryosphere – places dominated by ice, including ice sheets, sea ice, and permafrost – are described as featuring either tipping points, abrupt events, or irreversible changes in AR6, in keeping with other recent reports and analyses.
The West Antarctic ice sheet (WAIS) is listed by AR6 as a potential tipping element, with the possibility for abrupt and irreversible change. However, although some studies find a potential tipping point at 1.5-2°C and many studies find total WAIS loss committed at 2-3°C (pg.9-78), AR6 states in its summary that there is limited evidence for irreversible loss below 3°C (pg.9-9). This doesn’t so much mean the IPCC doesn’t think a WAIS tipping point exists, rather that there are simply not enough studies available to be sure if it could happen below 3°C. Irreversible loss is definitely expected beyond 3°C though, adding 3m+ to sea level rise over the next 2000 years and significantly extending the upper possible limit under high emissions. Subglacial basins in East Antarctica (including the Wilkes and Aurora basins) experience some loss below 3°C, and likely collapse at 3-5°C.
In contrast to the WAIS, the Greenland ice sheet (GrIS) is not described as a tipping element proper in AR6. This is based on a recent paper which didn’t find the same sharp transition to self-perpetuating ice loss as previous studies (pg.9-62). However, this paper did show that once around half the ice sheet was lost – likely somewhere between 2 and 3°C of warming – then full recovery became impossible even if temperatures returned to previous levels (something scientists call ‘hysteresis’), indicating some self-maintaining feedbacks are lost at this point. Some scientists might argue this is sufficient for GrIS to still be considered a tipping point, and that other studies did find a clearer threshold for self-sustaining ice loss, but either way it is clear that ~2°C+ destabilises the GrIS, and 3°C+ would cause irreversible GrIS loss and add 7m+ to sea level rise over the next 2000 years.

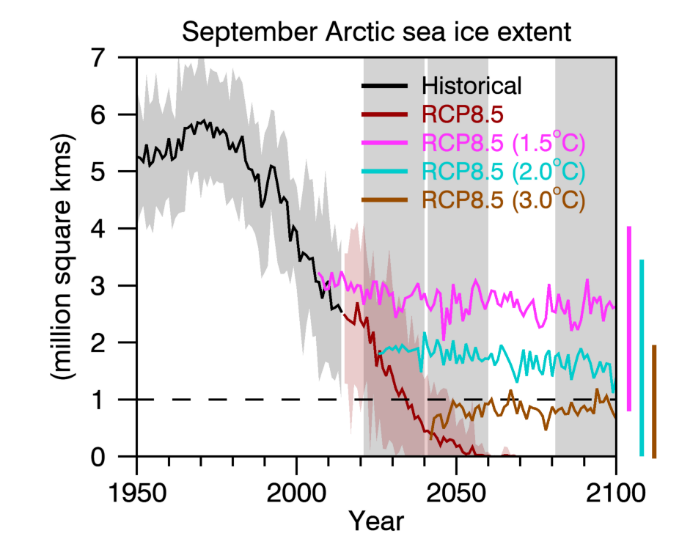
AR6 confirms that summer ice-free conditions will first periodically appear in the Arctic Ocean before 2050 in all emission scenarios, with ice-free years common beyond ~2°C of warming. But despite often being described as a tipping point case-study, AR6 confirms that Arctic summer sea ice doesn’t actually feature tipping dynamics itself (pg.9-48). This is because there’s no clear threshold beyond which further summer sea ice loss becomes self-sustaining, a key tipping point requirement. In contrast, Arctic winter sea ice often experiences a rapid (self-sustaining but reversible) collapse in models. Antarctic sea ice decline is also considered by AR6 as potentially abrupt, but is much more uncertain than the Arctic.
Ocean Circulation
The ‘Atlantic Meridional Overturning Circulation’ (AMOC) describes the northward movement of warm surface water up the Atlantic that then sinks off of Greenland (as a result of getting denser due to cooling and getting saltier as sea ice forms and takes up freshwater) and flows back down the deep Atlantic. Global warming, however, reduces sea ice formation and increases freshwater run-off from Greenland, and so interferes with this sinking. This will gradually weaken the AMOC, and there’s evidence from palaeoclimate records and some models that it could abruptly switch to a weaker mode. This would trigger severe cooling around the North Atlantic and disrupt the global monsoon, with potentially devastating consequences.
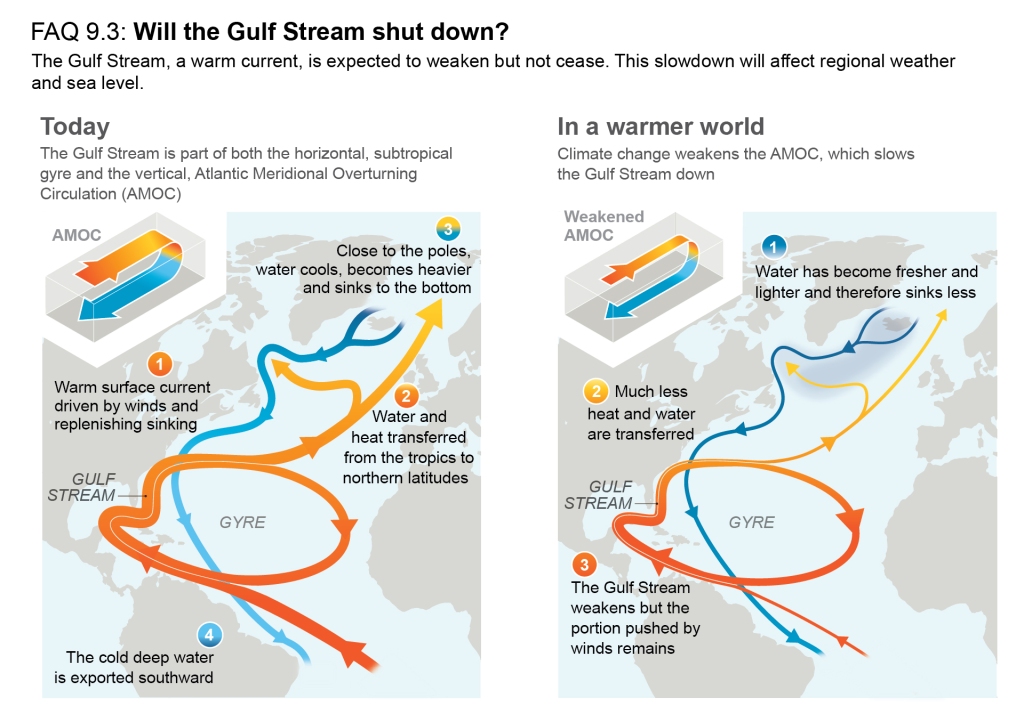
There is a mixed picture for the AMOC’s future in AR6, with confidence in historical decline actually reduced due to limited data and model mismatches. In keeping with recent reports, though, it judges that it is very likely that the AMOC will decline in the 21st century (albeit with low confidence on timings and magnitude) but that abrupt collapse is very unlikely before 2100 (and as likely as not by 2300). However, it’s noted that the models used for these projections tend towards over-stability and don’t feature the impact of run-off from the Greenland ice sheet. As a result, the IPCC now only has a medium confidence that the AMOC won’t collapse before 2100, and collapse remains possible in the longer term.

The IPCC have also included weakening of the Southern MOC (the equivalent around Antarctica to the northern AMOC) as a potential tipping point or irreversible/abrupt event. This is not typically included as a major tipping point in many analyses, but like with the AMOC a melt-induced shutdown would have global consequences. Models have struggled to capture the details of this ocean circulation, including lacking the impact of glacial meltwater on the nearby ocean, leading to lower confidence in these projections, but there have been some recent improvements. Current observations suggest the deep water mass it feeds (‘Antarctic Bottom Water’) has already started to shrink, and palaeo evidence suggests past meltwater pulses also weakened or even stopped this circulation. Based on this, the IPCC concludes with medium confidence that further weakening will continue through the 21st Century.
Other potentially irreversible or abrupt shifts
As well as potential tipping points, in AR6 the IPCC have also listed several potentially abrupt and/or irreversible shifts (in some cases in the same table, making it sometimes confusing as to whether they are considered to be tipping points by AR6 as well).


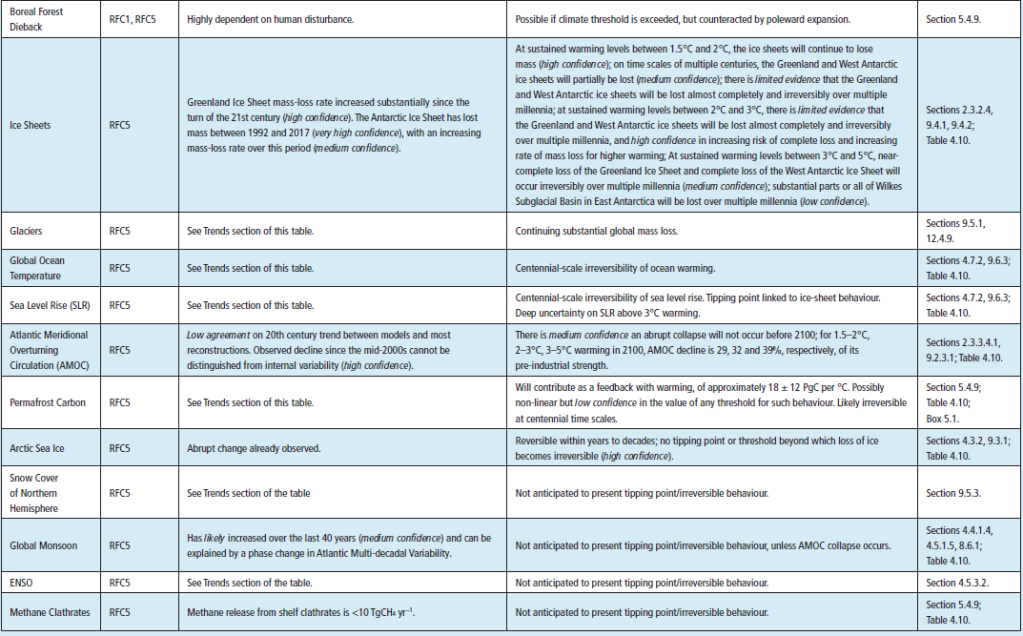
For example, both ocean acidification and deoxygenation are listed as irreversible in the deep ocean as a result of the very slow turnover time for water in the ocean, meaning heat and CO₂ entering the ocean now will remain for centuries. They are also listed as potentially abrupt as a result of sudden slowdowns in ocean circulation (such as SMOC or AMOC shutdown) that’d stop as much CO₂ or heat being taken in to the deep ocean. Neither acidification nor heat storage have clear tipping points in themselves though, although the impact of acidification is non-linear and becomes severe beyond an ‘undersaturation’ threshold that can be reached in polar waters. There is also now robust evidence that coastal acidification has negative effects on calcifying organisms, including coral reefs.
Sea level rise and ocean heat content are also not usually considered to be tipping elements in themselves, but are listed by the IPCC as subject to potentially abrupt or irreversible change. Both are considered irreversible for centuries due to the slow nature of ocean warming and ice melt, and long-term sea level rise commitment is heavily dependent on ice sheet tipping points (especially beyond ~3°C). However, neither directly feature tipping points in themselves, and are mostly listed for their irreversibility.

Another system not usually considered as a tipping point but listed alongside by AR6 is the ‘Global Monsoon’. This describes the switching of circulation and wet/dry patterns in certain regions (Central America, Central South America, southern Africa, African Sahel, South Asia, and northern Australia) in response to the seasonal cycle. It’s expected that warming will lead to global monsoon regions getting bigger and wetter (although monsoon circulation itself weakens) while drier regions elsewhere get even drier. It’s also likely that this has already started within the last 40 years, but with a lot of noise confusing this signal. An abrupt or irreversible shift is not expected unless forced by AMOC collapse, which palaeorecords and models suggest would lead to drying in the African Sahel region, Central America, the northern Amazon, and Europe (see maps above).
The multiyear global shifts in weather driven by ‘El Niño’ and ‘La Niña’ (more fully the El Niño–Southern Oscillation, or ENSO) are expected to remain a strong feature of the Earth’s climate and become more intense with warming. In particular, increased rainfall variability and an eastward shift of ENSO over the North Pacific and North America are considered very likely in AR6. However, no tipping behaviour or irreversibility is expected, in contrast to earlier worries that ENSO could tip to a ‘permanent El Niño’ state. Instead, a gradual intensification is expected with further warming, especially beyond 3°C of warming.
Implications for mitigation and adaptation
The second part of the report (from Working Group 2) on climate impacts on nature and people and to what extent they can be adapted to was released in February 2022. Its key messages were that climate change is already negatively impacting nature and people, with around 3 and a half billion people particularly vulnerable to further climate change, and the ability to successfully adapt through climate-resilient development declining above 1.5°C and heavily threatened beyond 2°C.

This was followed in April 2022 with the third part (from Working Group 3) on climate mitigation, i.e. how to reduce and stop emissions. It led with the message that emissions must peak by 2025 at the latest and then rapidly fall by 2030 and beyond for either 1.5°C or 2°C to remain possible, for which the solutions already exist but require significantly increased political ambition.
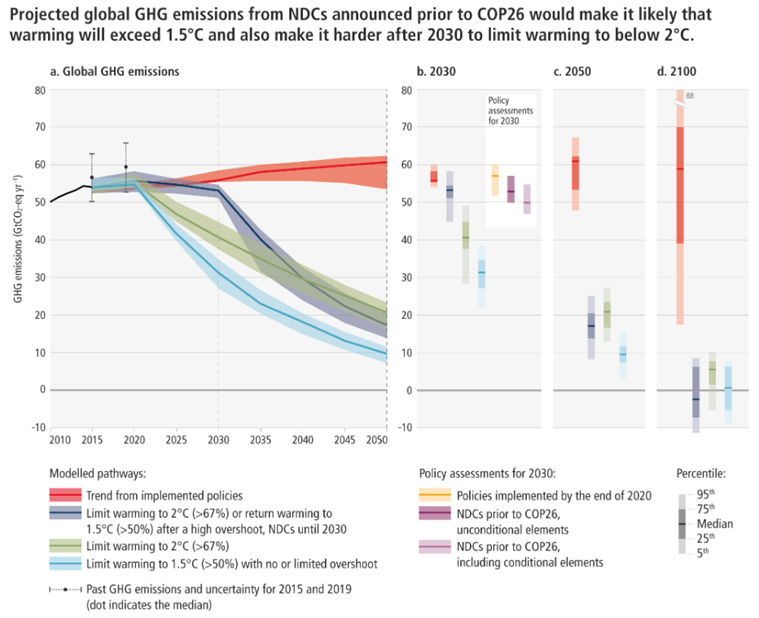
Both parts 2 and 3 of AR6 discussed the role of tipping points, their potential impacts on nature and people, and on their potential role in tackling climate change.
A reason for concern
The IPCC lists a number of “reasons for concern”, one of which are large-scale singular events, non-linearities, and tipping points (“RFC5”) such as ice sheet collapse, coral reef collapse, Amazon dieback, and permafrost thaw. They assess the risk of these events has already become moderate by 1°C, transitions to high around 2°C, and becomes very high within 2.5-4°C. The possibility of low probability but high impact climate scenarios such as these global climate tipping points or very high climate sensitivity makes climate risk management more complex and urgent.

Accounting for the possibility of climate tipping points and their catastrophic economic impacts substantially increases the estimated social cost of carbon, which many simple climate-economic models miss. This “fat-tail risk” leads the IPCC to state that greater political coordination is needed to drive emissions reduction when impacts seem long-term and gradual, and therefore seemingly non-urgent, before substantial impacts are locked in when tipping points are reached. Climate tipping points also make economic shocks and reduced economic growth more likely, and exposes some sectors and investors to significant financial risks.
Ecological tipping points
Both parts 2 and 3 of AR6 discuss the potential of land in adapting to and tackling climate change. They note that nature-based solutions such as tree-planting and soil protection are useful for both climate-resilient development and taking up some carbon dioxide, but are in no way sufficient to counter all current human emissions. However, the degree to which nature will continue to absorb carbon dioxide is uncertain. Land ecosystems currently act as a carbon sink by taking up around a quarter of human emissions, but at some point this absorption will begin to decline and eventually reverse as warming increases tree mortality and scarce nutrients limit further growth.
Some biomes such as the Amazon rainforest may also hit tipping points beyond which they shift to a dramatically different state, releasing substantial stores of carbon and amplifying global warming in the process. AR6 reports that 15% of land could experience significant biome shifts at 2°C of warming, increasing to 35% at 4°C of warming. The latter would see widespread Amazon rainforest dieback, Boreal forest zones jumping northwards, and treelines moving up through mountain meadow ecosystems. These biome shifts will limit the capacity of the land carbon sink, making it much harder to limit further warming.
AR6 states that extreme events on top of the gradual warming trend are already pushing some species and ecosystems to tipping points beyond which they lose resilience and can no longer adapt, leading to extinctions and abrupt shifts to radically different ecosystem states. In the ocean this could happen as low as 1.5°C, in particular in coral reefs, kelp forests, and polar regions, and in 2015 abrupt ecosystem shifts already occurred across 14% of the ocean. On land increased wildfires may already be pushing some regions to be permanently more open, and some forests could potentially see tipping points by 2°C. This threatens current conservation efforts and the ecosystem services that humanity (and in particular people with lower incomes) depend upon, and requires careful management to reduce rather than amplify the risk of ecosystem tipping points.
Social tipping points
Climate tipping points or higher levels of warming could in turn also trigger social tipping points, defined as when climate impacts trigger destabilising social transformations, such as land abandonment, forced displacement, or resource conflict in response to droughts, biome shifts, or sea level rise. Another example is the loss of traditional lifestyles for Indigenous Peoples in the Arctic as sea ice retreats, habitats become less suitable for reindeer/caribou herding, and thawing permafrost changes the landscape. However, significant uncertainties remain as to how and when social tipping points might occur, making them difficult to project and prepare for.
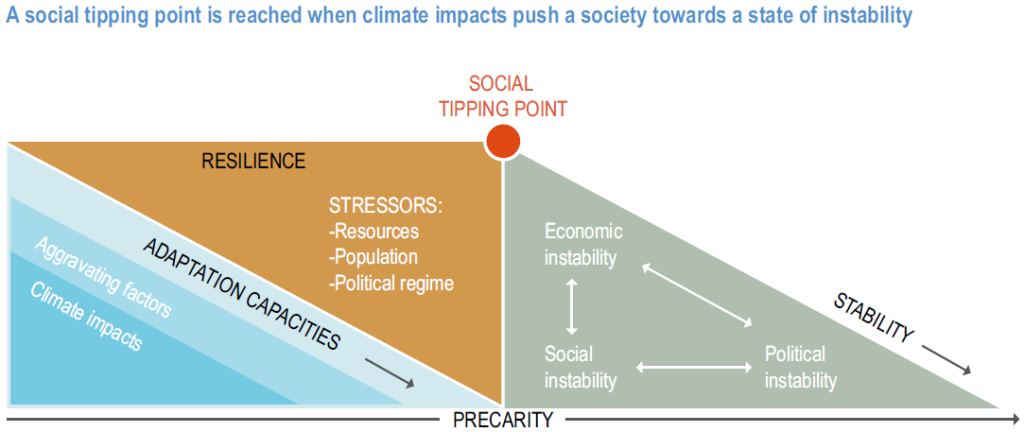
The IPCC also highlights the potential of “positive” social tipping points, which in contrast to the “negative” tipping points above could enhance and accelerate climate action. Some examples include government policies that led to rapid shifts from coal power to renewables in the UK and adoption of electric vehicles in Norway, divesting and removing subsidies from fossil fuels in favour of adaptation and low-carbon technologies instead, changes in social norms such as the shift back towards plant-based diets in richer countries, and the possibility that if around 3.5% population become engaged with a cause it can trigger rapid societal changes. As with negative social tipping points though these are all quite uncertain, with research in to how to purposefully trigger some of these positive tipping points only just getting going.
Summary
The latest IPCC report shows how far climate science has advanced in the previous ~8 years. The impact of carbon cycle feedbacks on the carbon budget and the future decline of natural carbon sinks in response to warming is now much clearer, and the possibility of tipping points and their implications for adaptation and mitigation is discussed in more depth. There are still some pretty big gaps in our knowledge on climate feedbacks and tipping points though, with AR6 holding off on giving estimates for likely global warming thresholds and impacts for many of the proposed tipping elements. And while the Earth system models used by the IPCC have improved since the last big reports they still struggle to include some key processes, making for example projections on future ice sheet loss or permafrost thaw more uncertain. Palaeoclimate evidence helps fill this gap though, indicating that tipping points were likely crossed during past episodes of climate change and could well be crossed again now. Even with these uncertainties it’s clear that further global warming only increases the risk of reaching tipping points and weakening natural carbon sinks, in particular beyond 2°C, making the case for keeping to the Paris Agreement target of 1.5°C even stronger.
~
This post was written by Dr. David A. McKay, a Climate-Biosphere Scientist working as a Research Consultant and Science Communicator at Georesilience Analytics. He’s currently working with Future Earth on the Earth Commission project, providing Earth system analysis and modelling support on setting safe and just limits for nutrients (focusing on ocean impacts) and for the climate (focusing on climate tipping points). This post and site are not externally funded, and the original post was proofread and edited by Dr. Rachael Avery.
Featured Image: IPCC WG1 front page artwork – Changing by Alisa Singer (“As we witness our planet transforming around us we watch, listen, measure … respond.”) www.environmentalgraphiti.org – 2021.
Change log: Updated 24/8/22 with extra material on the WG2 and WG3 report sections, copy-edited figures and tables with watermarks removed, and some minor edits for clarity elsewhere.

2 Comments