
![Pack ice on the Greenland Sea, east of Northern Greenland (72°N 18°W). Credit: Rita Wallaert (https://flic.kr/p/7V5GY) [CC BY-NC 2.0]](https://climatetippingpoints.info/wp-content/uploads/2023/08/greenlandsea2005_ritawillaert.jpg)
A recent study renewed worries that the ‘AMOC’ – a key set of ocean currents – could soon pass a tipping point and shutdown this century, with major ramifications for the climate. In this explainer we take a look at what the AMOC and similar currents are, whether they could really shutdown this century, and what the impact of their shutdown would be.
Bridging the Gulf Stream
Many people have heard of the ‘Gulf Stream’, a strong current of warm water in the North Atlantic driven by winds and the Earth’s rotation. Without it (and the North Atlantic Current it feeds into), Northern Europe would be as cold as Newfoundland & Labrador in Canada, and Spain as cold as New York, which are at the same latitude but is a lot colder without the warming influence of the Gulf Stream.
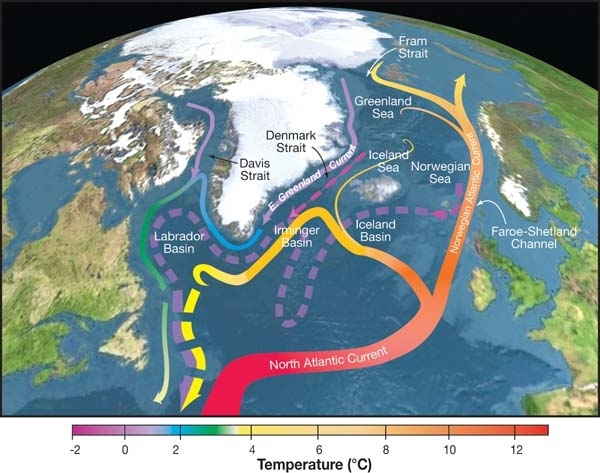
Most of this warm surface water returns southwards along the Eastern Atlantic, forming the return leg of the clockwise-turning ‘subtropical gyre’ current (which then returns along the equator). However, some of it carries on northwards towards the seas around Greenland instead, gradually cooling on the way. This makes the water slightly denser, as does getting gradually saltier through evaporation en route and sea ice formation further north (with brine squeezed out by ice freezing).
Eventually the northward-flowing water becomes denser than the water below, allowing it to sink to the bottom of the ocean (while deep water rises to take its place, mixing the ocean and together forming what oceanographers call ‘deep convection’). Once there, the now cold, dense, deep water starts flowing southwards along the Atlantic Ocean floor, until it eventually re-emerges (‘upwelling’) at the surface in the Southern, Indian, or Pacific Oceans.

Together the Atlantic leg of this is known as the ‘Atlantic Meridional Overturning Circulation’, i.e. the AMOC, so-called because this deep mixing ‘overturns’ the ocean, and it transports water across latitudes (which is known as a ‘meridional’ flow, whereas across longitudes is known as ‘zonal’ flow). The AMOC forms a key part of the global thermohaline circulation, sometimes referred to as the ‘ocean conveyor belt’, which is the pattern of global ocean circulation driven by differences in temperature and salinity.
Slowdown showdown

Global warming, however, is warming up surface water and increasing rainfall in the key mixing region, along with increased freshwater run-off from Greenland and reduced sea ice formation. These tend to make surface water less dense, and so interferes with the sinking process and reduces deep convection.
Models used by the IPCC project that this process will gradually weaken the AMOC over the course of this century:
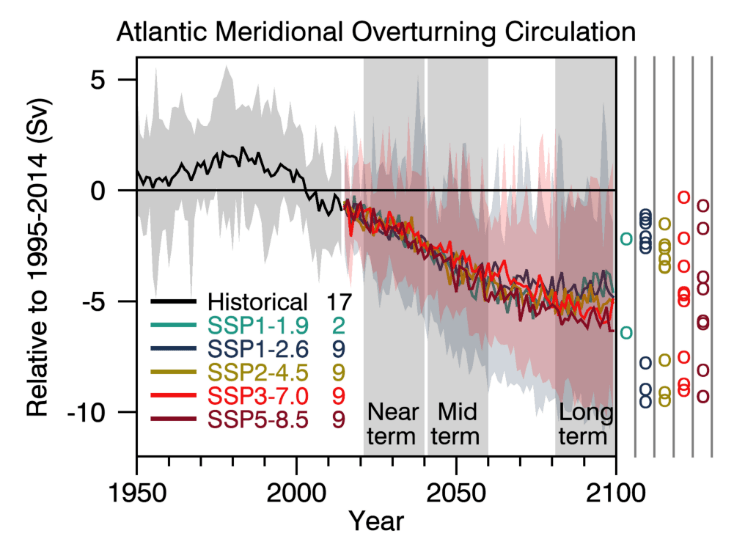
Some evidence suggests that the AMOC may have already weakened by around 15% over the past 50 years, and is now at its weakest strength over the past 1000 years. AMOC strength has only been directly measured for the last 20 years though, so before that we have to rely on more uncertain reconstructions of past climate. This means it’s hard to be sure if the recent slowdown is definitely the result of human-driven global warming or is still within its natural range of variability, while some other reconstructions show limited evidence of decline so far (although with future decline still expected).
This mixed evidence led the IPCC to state in 2013 that there was “no observational evidence of a trend in the [AMOC]“. [N.B. this was from AR5, not AR6 as stated in this recent article and subsequently restated by contrarians without clarifying the changed IPCC position since]. This has been updated in more recent IPCC reports to that the “AMOC has weakened relative to 1850–1900” but with only low confidence due to disagreements between reconstructions and models.
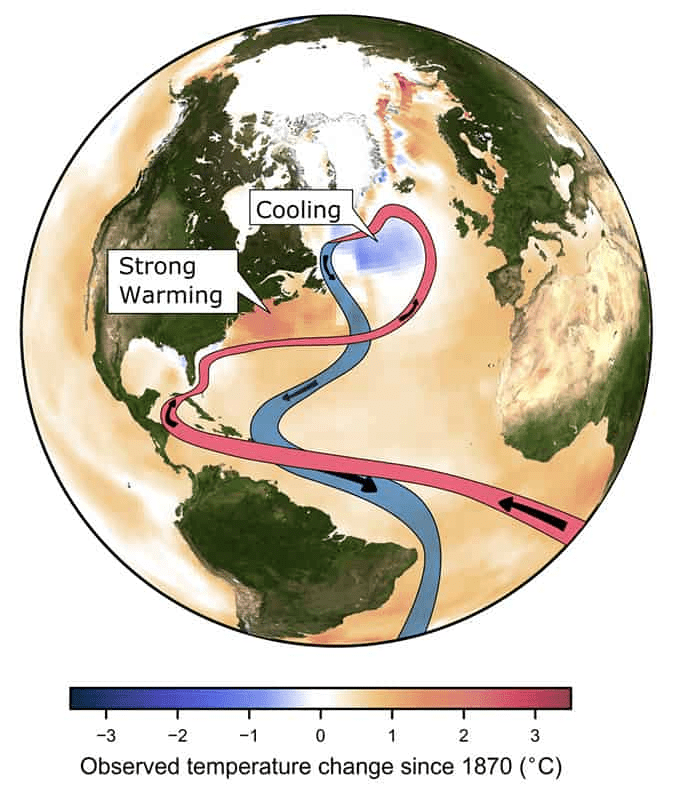
Despite this, the so-called “cold blob” or “warming hole” has been suggested as a key sign of ongoing AMOC weakening. This is a part of the North Atlantic where there’s been overall atmospheric cooling, in stark contrast to global warming. One explanation for it is that a weaker AMOC transports less heat northwards, leading to cooling towards its northern end. The cold blob could also be linked to local atmospheric effects though, so its driver is still not certain.
Flowing hot and cold
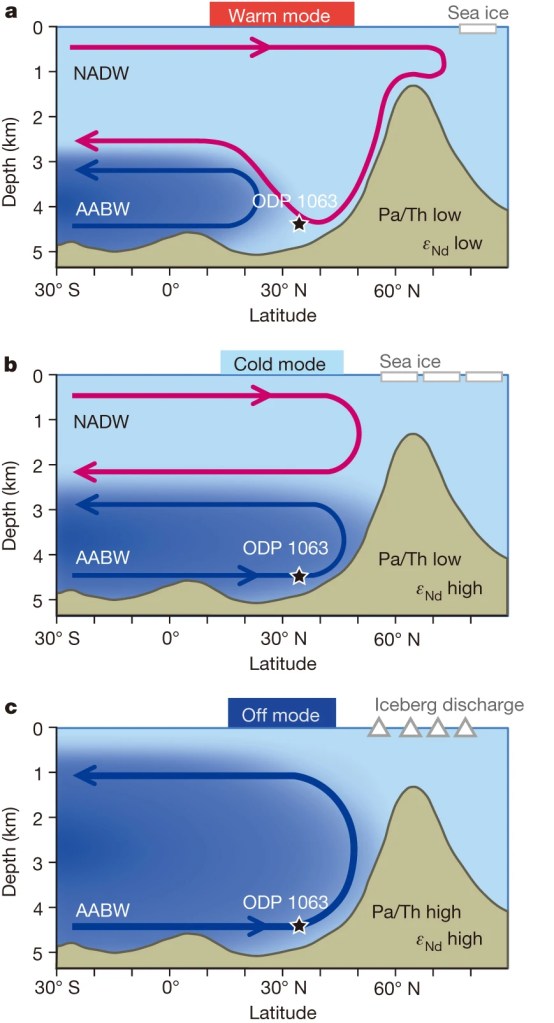
The model projections used by the IPCC above show a relatively gradual slowdown in the AMOC with climate change, with no abrupt collapse this century. However, evidence from geological records suggests the AMOC has abruptly switched between stronger and weaker modes during recent glacial cycles.
Most of the time (including the warm ‘Holocene’ of the past 12,000 years) the AMOC is in a strong state, but during the peak of glacial periods (when ice sheets covered the norths of Europe and North America) it sometimes shifted to a weak state instead. It also occasionally collapsed entirely to a much weaker (or even totally off) state during ‘Heinrich events‘. These occurred when outbursts of icebergs from the North American Laurentide ice sheet temporarily blocked Atlantic overturning for several centuries, likely through massive freshwater release.
Simple models made in the 1960s found that adding the ‘salt advection’ feedback described earlier meant the AMOC could abruptly switch between strong and weak regimes, as suggested by geological records. However, as models have got more realistic and complicated there have been mixed results and disagreement over exactly how easily such a tipping point could be reached. In many models the AMOC only collapses after centuries of high emissions, or by strong and targeted freshwater inputs (up to 1 million cubic metres per second) which might not be possible from current ice sheets. However, recent work has confirmed that the AMOC can collapse even in high complexity ‘Global Climate Models’, while others suggest the AMOC could have many states and tipping points.
The IPCC assessed in its most recent AR6 report that it is very likely that the AMOC will decline in the 21st Century (albeit with low confidence on timings and magnitude), but has medium confidence that abrupt collapse very likely won’t happen before 2100 (and is as likely as not by 2300). Similarly, a recent paper suggests the AMOC is tracking models that weaken somewhat less by 2100, with no collapse simulated by then. However, this doesn’t rule out collapse after then, and the IPCC note that the models used for these projections have key limitations:
Tuning towards stability and model biases… provides CMIP models [the complex climate models used by the IPCC] a tendency toward unrealistic stability (medium confidence). By correcting for existing salinity biases, Liu et al., (2017) demonstrated that AMOC behaviour may change dramatically on centennial to millennial timescales and that the probability of a collapsed state increases. None of the CMIP6 models features an abrupt AMOC collapse in the 21st century, but they neglect meltwater release from the Greenland ice sheet and a recent process study reveals that a collapse of the AMOC can be induced even by small-amplitude changes in freshwater forcing (Lohmann and Ditlevsen, 2021).”
IPCC AR6 WG1 Chapter 9 (9.2.3.1) [emphasis & explanatory notes added]
Improving model biases and including Greenland meltwater could therefore make long-term AMOC collapse more likely in models, even in cases with gentler 21st Century weakening, but these will take time to account for.
More recently, analysis of the few of those models that have been run centuries beyond 2100 found that the AMOC collapses (i.e. reaches 20% of pre-industrial strength) in all high emission simulations, and even in some medium and low emission scenarios:
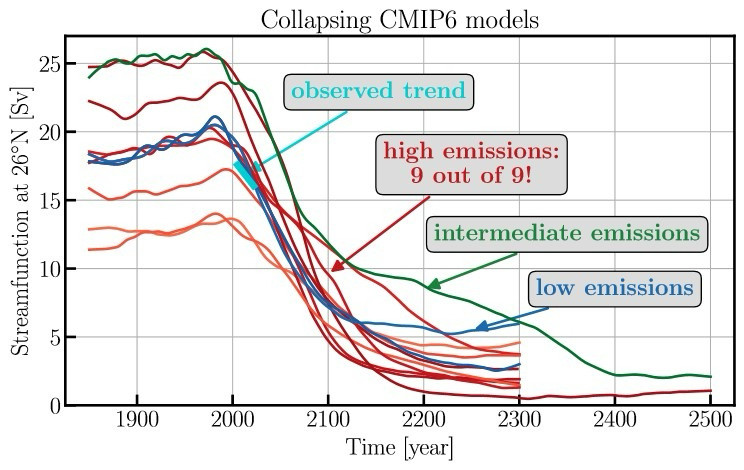
Noting that all simulations in which AMOC strength declines below a certain level by 2100 eventually collapse, they estimate 70% of models would see AMOC collapse under high emissions, 37% for medium emissions (roughly matching current trajectory), and 25% even for low emissions. This is seemingly in conflict with another recent paper which found AMOC did not collapse in these models even under artificially high emissions and freshwater input (as circulation changes in other oceans help balance AMOC weakening). However, these still saw considerable weakening (nearly 60% overall) and only ran for 100-150 years, so longer runs might well see more collapses.
It should be noted that AMOC collapse wouldn’t stop the Gulf Stream though – they’re often mixed up, but while they’re connected they’re not the same thing. As veteran oceanographer Carl Wunsch put it, the “Gulf Stream [is] safe if [the] wind blows and [the] Earth turns”, and the Nordic Sea leg of it may have actually increased over 20th Century (but that doesn’t contradict evidence of potential AMOC slowdown). The Gulf Stream is also bigger, transporting around 30 million cubic metres per second (or 30 ‘Sverdrups’) east of North America and reaching around 90 Sv at its peak, compared to around 15-20 Sv for the AMOC (the rest of the Gulf Stream total stays in the subtropical gyre). AMOC collapse would still have major impacts though, as shown further down.
Subpolar gyring
Recent modelling suggests that some of the North Atlantic deep water convection might be able to shut down much sooner than the rest of the AMOC.
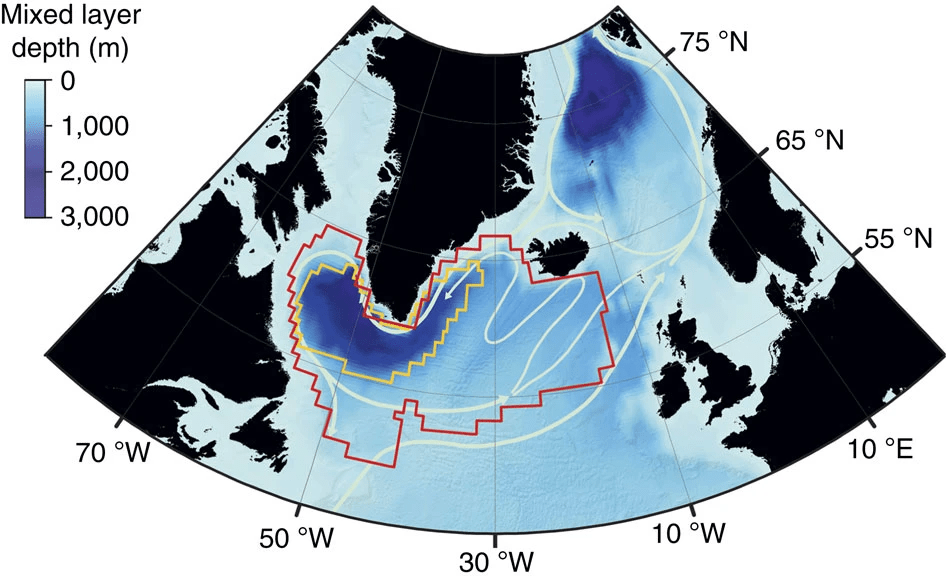
While most convection happens in the seas east of Greenland, deep mixing also occurs around Greenland’s southern tip in the Labrador and Irminger Seas. This mixing helps drive the ‘subpolar gyre’ (SPG), the anti-clockwise counterpart to the subtropical gyre to the south. In the SPG cold water flows southwards along the Canadian coast, joins the warmer North Atlantic Current heading east, and then splits back off to return and cool in the Labrador-Irminger Seas.
In the last two major comparisons of models generating simulations for the IPCC (the ‘Coupled Model Intercomparison Project’ rounds 5 and 6, i.e. CMIP5 and CMIP6) some models found that deep mixing in the Labrador-Irminger Seas could collapse before the wider AMOC. As with the AMOC, increased warmth and freshwater inputs can disrupt the sinking process in the SPG, with self-sustaining feedbacks eventually driving the collapse of convection beyond a threshold.
While this collapse only happened in a few models, those models did the best job at representing surface mixing dynamics. As a result, the studies assessing the SPG in these models estimate the chance of SPG collapse at around 40%. What’s more, collapse was triggered at an average of only 1.8°C (and in some simulations as low as 1.1°C) and only took around a decade to collapse. This makes SPG collapse a distinct (but not certain) possibility this century even with lower emissions, and would likely precede wider AMOC tipping.
The SPG’s strength is highly variable though and so its current trend isn’t clear, but SPG weakening could potentially be driving the North Atlantic cold blob instead of the AMOC. A weak SPG may also have played a role in Europe’s ‘Little Ice Age‘ during the 16th-19th Centuries.
Southern discomfort
The IPCC also included weakening of the Southern Meridional Overturning Circulation (SMOC – the equivalent around Antarctica to the northern AMOC, also known as the Southern Ocean or Antarctic Overturning Circulation) as a potential tipping point or irreversible/abrupt event in their most recent report.
The SMOC was not previously included as a tipping point in assessments, but as with the AMOC an ice melt-induced shutdown would have global consequences. Models have struggled to capture the details of Antarctic overturning, particularly the formation of dense water that overflows from Antarctica’s coastal shelves and the impact of glacial meltwater on this, but one earlier study estimated shutdown could happen at 1.8 to 3°C of global warming. This has led to lower confidence in these projections, but there have been some recent improvements.
The IPCC’s most recent report assessed that current observations suggest the deep water mass it feeds (‘Antarctic Bottom Water’) has already started to shrink, and geological evidence suggests past meltwater pulses also weakened or even stopped this circulation. Based on this, the IPCC concludes with medium confidence that further weakening will continue, while evidence for the involvement of positive feedback loops led the Global Tipping Points Report to reassess it as a likely tipping system with medium confidence, but with an uncertain warming threshold.
Ocean current affairs
Several studies have come out in recent years suggesting that the AMOC may be closer to collapse than anticipated, triggering worried media coverage.

The first of these searched for statistical ‘early-warning signals‘ in the AMOC, finding the strength of these early-warnings are increasing. However, early-warnings can’t tell us exactly when such a tipping point might arrive or even if the system definitely features one, as a system getting less resilient can also generate early-warnings even if there’s no alternative state to tip to.
Additionally, the data analysed were reconstructions of temperature and salinity from the cold blob area, used as a longer indirect ‘fingerprint’ of the AMOC rather than direct measurements of its strength that only go back two decades. This gives long enough data to analyse for early-warnings, but using indirect proxies adds uncertainty, and some scientists are not convinced they’re a good enough proxy for the AMOC. Despite this, this paper suggests the AMOC may be being destabilised, and if there is a tipping point it’s getting closer.
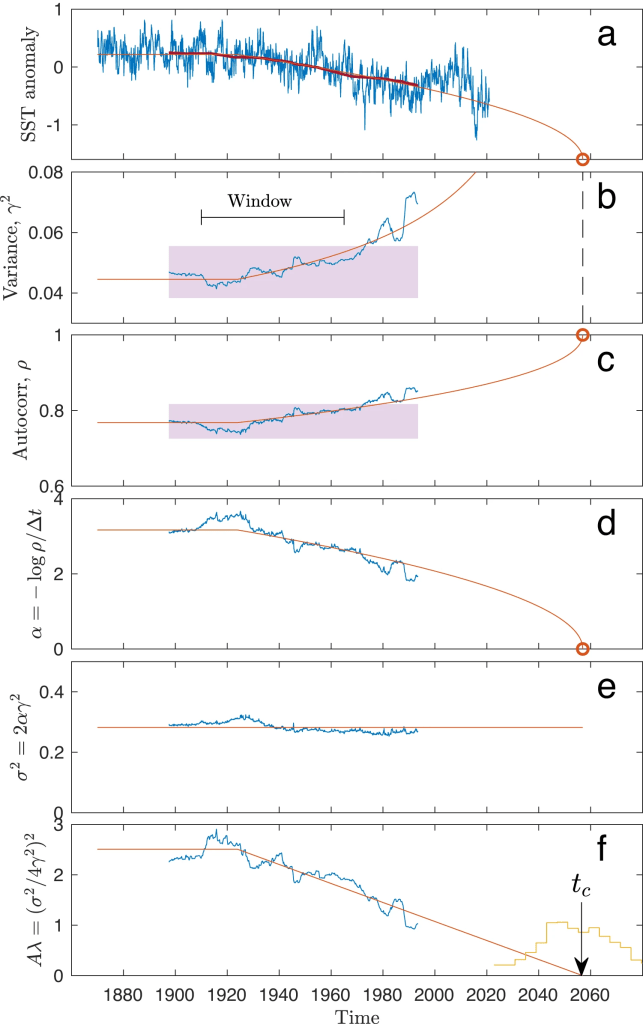
The same issues apply for the paper that recently triggered global media coverage suggesting the AMOC could collapse as soon as 2025. This paper also used an indirect AMOC fingerprint, and found that early-warnings in it are increasing. They then fit a simple model of AMOC collapse to the data (assuming it takes the form of what is known mathematically as a ‘saddle-node bifurcation’), showing the model generates similar early-warnings up to now. They then extended the model into the future to show it hits a tipping point by around 2050, with a possible range from 2025 to 2095. That means if the model is right AMOC collapse is possible but not yet likely from 2025, contrary to what many headlines implied.
As with the previous study, early-warnings can indicate tipping is approaching, but is not direct proof of a tipping point existing. The closeness of the fitted model’s early-warnings to the observations is compelling, but scientists have pointed out the model is highly simplified, the model’s tipping dynamics are assumed, and the uncertainties are too high to be able to robustly predict tipping times. And similar to above, the data used is a single indirect reconstruction, so the analysis will need to be repeated on different reconstructions to be more sure.
Effectively what this study tells us then is that in one indirect measure of the AMOC its statistical properties are consistent with destabilisation, and if we assume it’s approaching a particular type of tipping point then it could collapse within decades. However, it doesn’t directly show that collapse is coming. That a simple AMOC collapse model can produce similar early-warning patterns as seen in this dataset is indirect evidence for AMOC tipping dynamics being possible though, and collapse this century can be seen as a worrying reasonable worst-case scenario.
Another recent paper projected that Antarctic meltwater could drastically slow the SMOC this century based on a new model that better captures dense shelf water formation. When including increased meltwater from Antarctica in a no climate action scenario with high emissions, overturning declines in this model by more than 40% by 2050:

SMOC collapse would have multiple knock on effects. More warm water would make it towards Antarctica’s coast as a result, potentially accelerating ice sheet retreat and meltwater input (this potential feedback hasn’t yet been included in modelling though). Less overturning means reduced formation of Antarctic Bottom Water, which would have knock on effects for places where this cold, nutrient-rich water returns to the surface and supports rich ecosystems. Weaker overturning would also tend to mean fewer nutrients for the Southern Ocean’s abundant plankton, as well as less human-emitted CO2 being absorbed from the atmosphere and transported to the ocean depths.
Some have questioned why this study used a very high emissions scenario (‘RCP8.5/SSP5-8.5’) with no climate action at all, which is now considered to be highly unlikely. However, under more likely scenarios the same warming (and therefore Antarctic melt levels) occurs by 2100 instead of 2050 anyway, meaning the modelled decline would simply be delayed a few decades. Antarctic melt also tends to be under-estimated in ice sheet models, and the melt scenario used here was not the highest. Finally, the modelled overturning was not shown to be self-sustaining, so it’s not clear yet if it features a tipping point or is simply responding proportionally to global warming level.
The Century After Tomorrow
The collapse of Atlantic overturning currents would have major regional and global impacts.
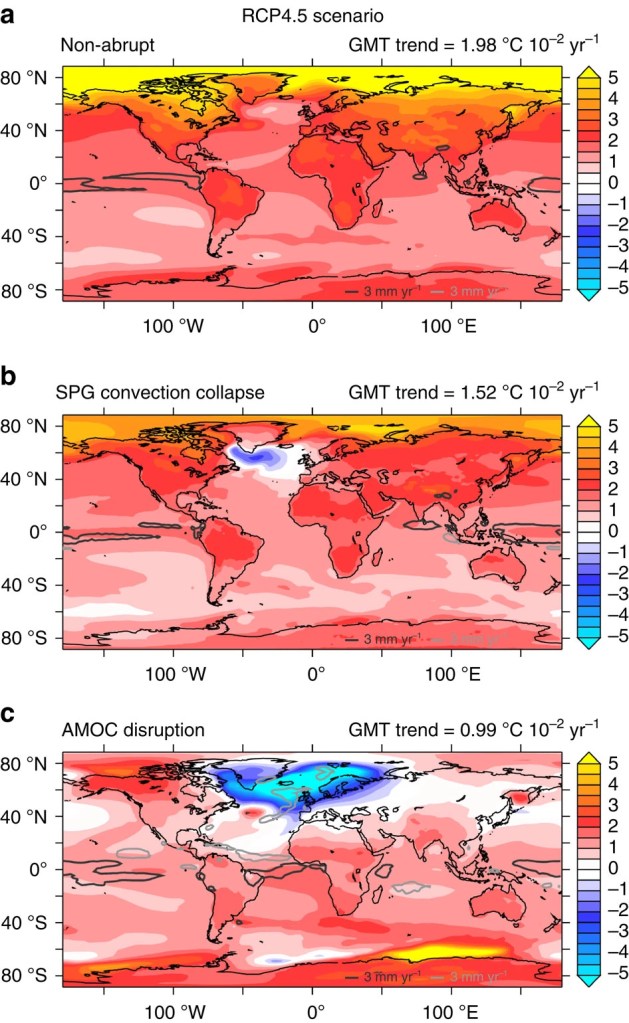
AMOC collapse would trigger substantial cooling across the North Atlantic, with up to 10°C of cooling in the core sinking regions and several degrees of cooling in Northern Europe and coastal Labrador & Newfoundland in Canada (particularly in winter). Much of the world would see a small amount of cooling too (even temporarily counteracting a few decades of global warming), but the Southern Hemisphere would see some warming – particularly around Antarctic coasts – as less heat would be transported by ocean currents to the Northern Hemisphere. This could help accelerate ice sheet melt in Antarctica, making it easier for the vulnerable West Antarctic Ice Sheet to tip too.
This cooling would also tend to shift the Northern Polar Jet Stream northwards and affect Atlantic storm tracks, changing weather patterns particularly in Europe. Together with regional cooling and drying this would have dramatic impacts – in one study it leads to arable agriculture in Britain no longer being economically feasible, less vegetation and lower crop yields across Europe, and marine life would substantially shift within the Atlantic.

SPG collapse would have a similar but smaller impact to collapse of the wider AMOC, with net cooling of 2 to 3°C south of Greenland, and global warming effectively cancelled out on the coasts of Western Europe and Eastern Canada.
Recent model simulations suggest that the impacts SPG collapse might resemble the positive phase of a natural cyclic weather phenomenon called the ‘North Atlantic Oscillation’ (NAO). NAO-positive conditions tend to include winters being warmer and wetter in Northern Europe, drier in Southern Europe, and colder and drier in North-East Canada, and summers being warmer and drier in Northern Europe, colder and wetter in the Mediterranean, drier in West Africa, and warmer and drier in Central Canada. However, modelling of specific SPG collapse impacts is currently scarce.
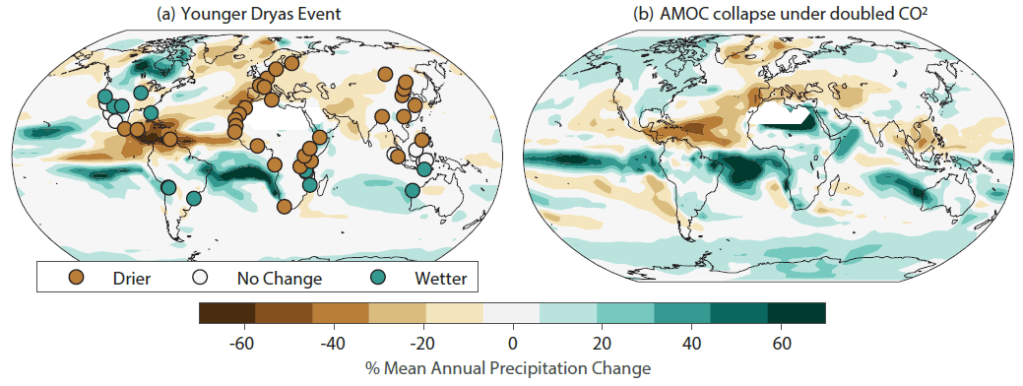
Despite suggestions in response to recent coverage of AMOC collapse that there’s no evidence that AMOC slowdown or collapse would change rainfall patterns around the world or cause damage to the Amazon, the latest IPCC report is clear that AMOC collapse would impact the global water cycle far beyond the North Atlantic:
“Multiple lines of evidence, including both paleoclimate reconstructions and simulations, suggest that a severe weakening or collapse of Atlantic Meridional Overturning Circulation… causes abrupt and profound changes in the global hydrological cycle… AMOC collapse results in a southward shift in the ITCZ [the Inter-Tropical Convergence Zone, which determines monsoon patterns] that is most pronounced in the tropical Atlantic. This could cause drying in the Sahel region [south of the Sahara]… as well as Mesoamerica and northern Amazonia… AMOC collapse also causes the Asian monsoon systems to weaken… counteracting the strengthening expected in response to elevated greenhouse gases. Europe is projected to experience moderate drying in response to AMOC collapse…”
IPCC AR6 WG1 chapter 8 (8.6.1) [with emphasis & explanatory notes added]
This would have a substantial impact on tropical and subtropical countries, particularly in Central America, West Africa, and parts of Asia where many depend on monsoon rainfall. It could also affect the resilience of many tropical rainforests, with carbon cycle models projecting tropical and boreal forest carbon sinks weakening and more CO2 staying in the atmosphere as a result of AMOC collapse. It could also interact with Amazon dieback, though models show a mixed picture – while AMOC collapse might dry out northern Amazonia, it might actually wetten the more at risk east & south, with AMOC weakening potentially already helping to offset dome drying.
Summary
While the Gulf Stream itself is safe, evidence from ancient climate change and models is clear that we can expect the AMOC to slowdown with further human-driven warming. “Collapse” of the AMOC is also possible in the long run, with the chance growing with further warming, and some recent studies suggesting there are signs it’s already unstable. Such a collapse would be devastating to people and nature around the North Atlantic, and cause damaging shifts in the global water cycle. However, the timing and likelihood of AMOC collapse is uncertain, and “early warning signals” can’t show if a tipping point is definitely approaching.
The small but non-zero chance of AMOC tipping at even Paris Agreement levels of global warming is worrying though, as is the IPCC’s assessment that current climate models tend toward unrealistic AMOC stability. The possible earlier collapse of the related SPG in the Northwest Atlantic presents a nearer-term risk, and evidence is growing that the Antarctic SMOC is also slowing down. Minimising the risk of these currents collapsing requires global warming to be kept as close to 1.5°C as possible, which would mean greenhouse gas emissions have to fall rapidly.
~
This post was written by Dr. David Armstrong McKay, then a Research Impact Fellow at the University of Exeter and Associated Researcher at Stockholm Resilience Centre., and now a Lecturer at the University of Sussex.
Featured Image: Pack ice on the Greenland Sea, east of Northern Greenland (72°N 18°W). Credit: Rita Wallaert (https://flic.kr/p/7V5GY) [CC BY-NC 2.0]
Edits log: 18/8/23 clarified sinking/convection differences; 29/8-1/9/25 added some more recent AMOC studies published since 2023.

This one should get an update with the new research!
LikeLike
Now updated with some key papers since 2023!
LikeLike
Thoughts on this study?
https://www.nature.com/articles/s41561-025-01709-0
LikeLike
Ah yes, that’s a good recent one to add in as well! In general, it suggests what we’re seeing in the actual AMOC is tracking the models that weaken somewhat less by 2100, but it still weakens quite a bit, and collapse in the long run after 2100 can’t be ruled out either. More significantly (and as noted in the paper), current models are known to be biased in ways that favour AMOC stability, such that even next-gen models with gentler 21st Century weakening could still precipitate a collapse sooner than current models suggest. Overall then, I think this paper still fits general conclusion that the AMOC definitely weakens with warming and the larger that warming the more likely it is to collapse in the long (i.e. after 2100) run.
LikeLike