
The first of a new occassional ‘News Explainer’ series, briefly summarising recent news on climate tipping points (and checking how well the media reported it). Click here for our in-depth Explainers.
The tl;dr
A new scientific study out a few weeks ago used a different way of comparing models to observations to show that climate models with greater future declines in the AMOC – the set of ocean currents bringing warm water up the Atlantic before it sinks – fit the data better. Based on this, they project the AMOC to decline faster than previous estimates, reaching around half by 2100 under currently expected emissions. Many media reports got the gist of this right, and there were reasonable extrapolations that this result implies eventual collapse and a potential tipping point could come sooner than expected. Howeve, some articles conflated collapse with tipping, and others conflated the study’s 51% expected weakening with an independent estimate of a more than 50% likelihood of tipping ithis century.
What’s the news?
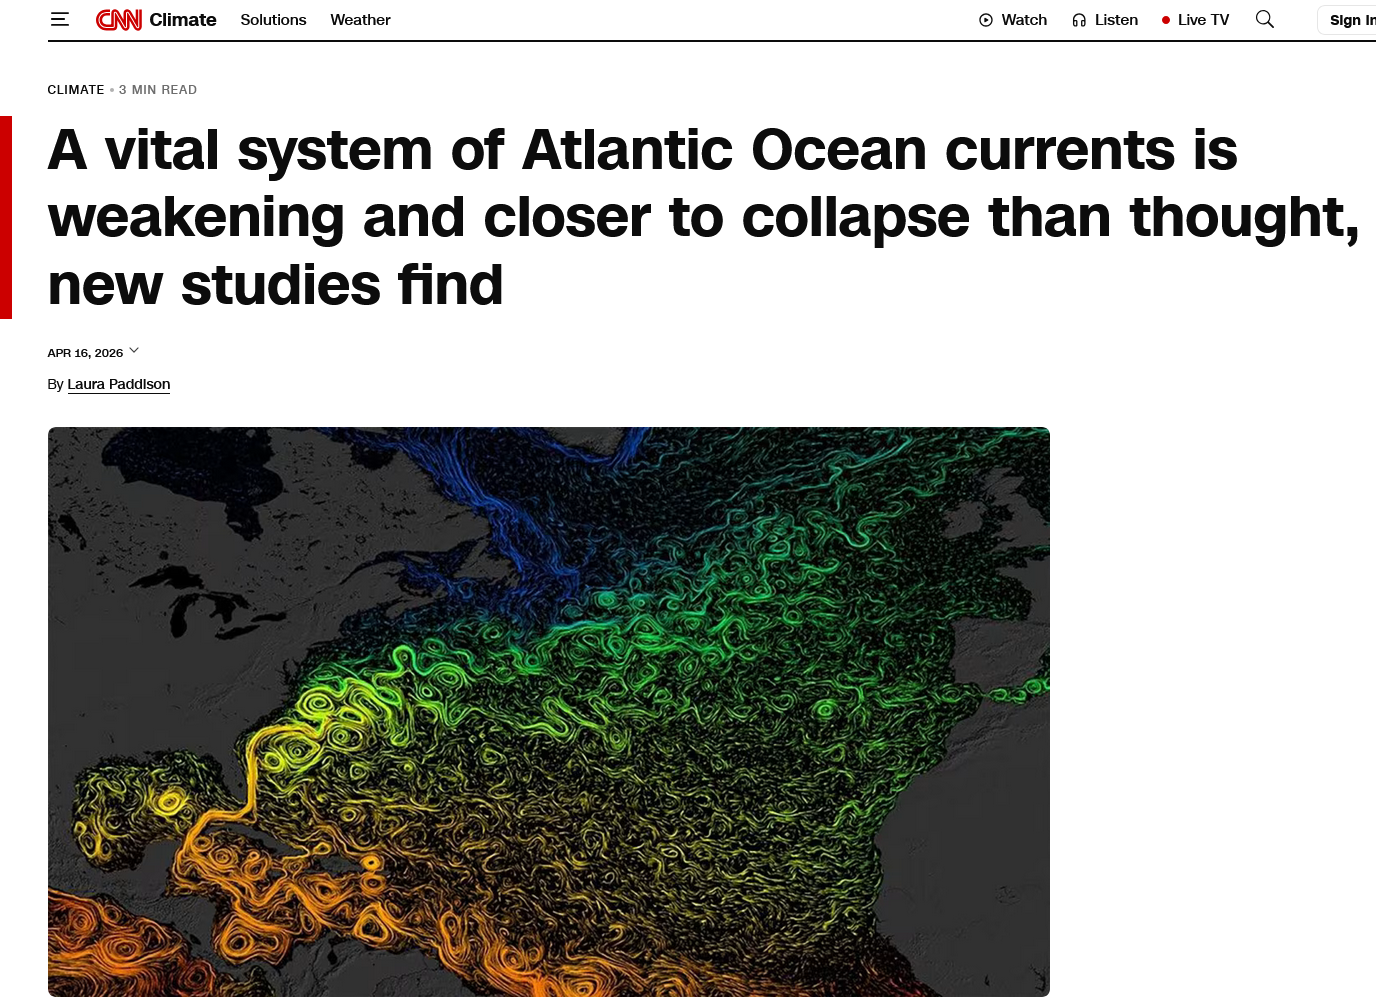
A new study on the ‘Atlantic Meridional Overturning Circulation’, or AMOC – the subject of a previous climatetippingpoints.info explainer on how it might tip and the substantial impacts if it did so – came out last week in the Science Advances journal, triggering headlines like this:
What did the study show?
Various climate models have been used to project how much the AMOC will weaken under different levels of future emissions, summarised by this plot from the study showing results from the ‘CMIP6’ models used by the latest IPCC report:
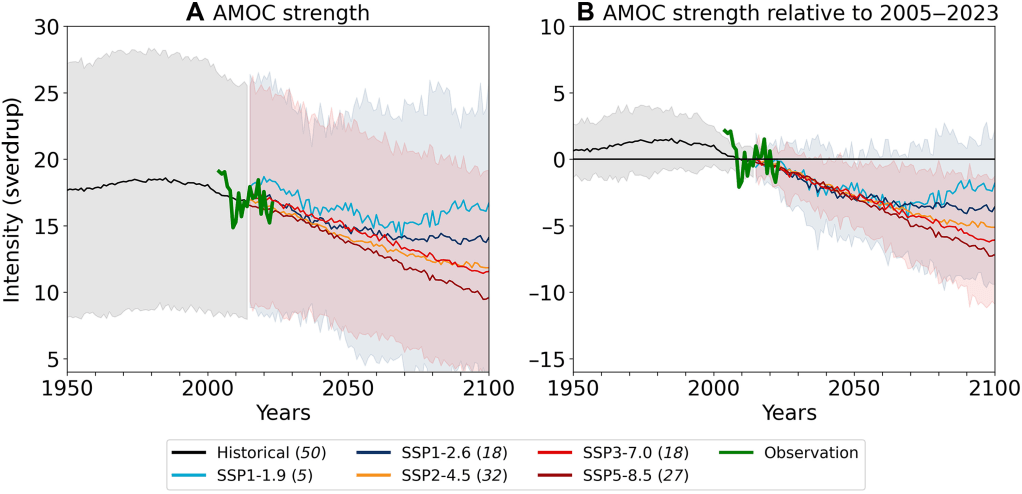
The shaded areas indicate a lot of variability across the models, with some starting out with very strong or very weak AMOCs to start with, and in future some projecting a mild or even no decline, and others nearly collapsing (generally defined as 80% below the recent baseline).
What this paper by Portmann & colleagues does is to use a technique called ‘emergent (or observational) constraints‘ to try and narrow this range down, by focusing on the models that capture a key process (or several key processes) the best.
In this case, the degree of AMOC weakening in models is directly related to either just recent AMOC observations, or also including other observations and past sea surface temperature and salinity in key regions. By comparing what this value is in models versus what we observe in the real-world, the authors can give more weight to the models that capture this observation – and therefore likely the degree of AMOC weakening for that emission scenario – the best.
This has been tried for the AMOC before, including one last year finding models with less AMOC decline to fit observations the best, but what this study does differently is to try out various different methods for weighting the best models. It finds that one method not used before in climate science – called ‘ridge-regularised regression‘ – does a better job here (specifically, a lower ‘leave-one-out’ error) at picking out the models that best fit observations.
Using this method gave a tighter observational constraint than before. Instead of weakening by 32 ± 37% (i.e. between a 5% strengthening and a 69% weakening) by 2100 in the ‘SSP2-4.5’ intermediate emissions scenario that we are most closely following, this study narrowed it down to only 51 ± 8% (i.e. between 43 & 59% weakening), a much narrower and definitely negative range. In a lower emission SSP1-2.6 scenario, which leads to more like 1.8°C rather than 2.7°C warming by 2100, only 19.5 ± 25.4% of weakening is expected, showing how much weakening can be avoided.
These contrast with the last year’s paper by Bonan & colleagues, which used a different observational constraint-based approach to project an 18–43% decline across all scenarios, but this new study suggests that using multiple observations and their method is a better approach.
Does this mean the AMOC will likely tip this century? I saw somewhere say there’s a 50% chance of that now
There are two issues here: how to intrepret “collapse” in the context of what this paper shows, and how to interpret the headline 51% weakening.
It has been shown recently (e.g. here & here) that in the long run more of the latest-generation complex climate models are capable of tipping dynamics than thought, with some of these likely passing tipping points within the next few decades and reaching a shutdown state from 2100. However, this current study covers many more models, many of which have a more linear relationship between warming and AMOC strength. In these, the AMOC declines in step with warming, and shutdown is possible without tipping, reaching as low as an 80% linear decline in more sensitive models.
What this new paper shows is that the models that get to this shutdown state sooner – whether via linear decline or tipping-induced collapse – are more likely based on observations (although as noted above, not all such studies agree). However, the paper’s result ranges do not reach the 80% collapse level by 2100, which is when the study stops. Given the rate of decline, it is likely that the AMOC in models seeing a ~50% decline by 2100 will reach 80% at some point after, but that is not directly shown in this study, and stabilisation after 2100 is possible in some models.
Some model AMOC declines covered by this study are potentially tipping-driven. However, as tipping dynamics are hard to infer from these model runs, these results do not directly tell us much about whether a tipping point may happen sooner, just that more sensitive models seem to fit observations better. Instead, the argument about tipping is indirect: in quotes to the media, the authors argue that “this means we have an Amoc that is closer to a tipping point“, with other experts noting that “every additional AMOC weakening pushes the system towards the tipping point“, indicating how faster decline would likely bring any such tipping point closer, both in terms of time and warming level.
There is also some potential confusion around the headline 51% weakening figure from the paper. This looks similar to the 50% chance of a tipping-induced shutdown that’s been quoted in some places, but the paper’s 51% is the average expected weakening by 2100 (which after that may lead to shutdown), not the probability of shutdown itself (either from tipping or linear decline). Instead, the 50% collapse likelihood figure appears to be an independent expert judgement based on this and other recent results, and is not a direct result of this study.
This latter assessment is linked to this study from last year, in which several CMIP6 models run beyond 2100 eventually reach a collapsed state by 2300 or 2500, and most models declining by 50% by 2100 ended up shutting down in the long run:
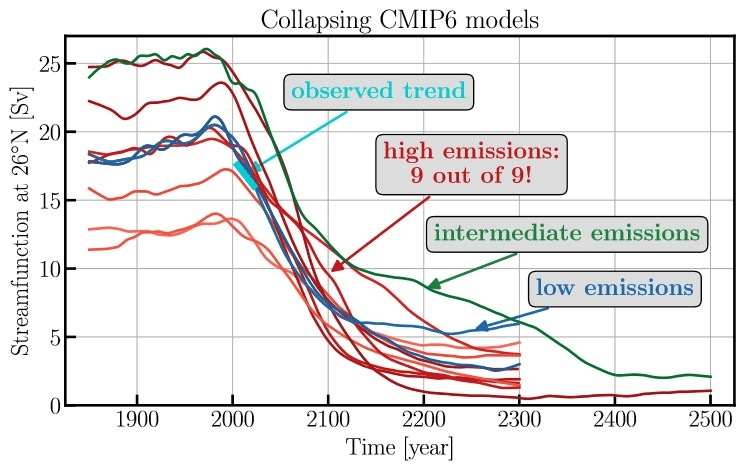
Extrapolating from the trends of those declines, the authors of that study estimated that ~25% of models in low emission scenarios (i.e. SSP1-2.6), 37% of models on intermediate/current emissions (SSP2-4.5), and 70% of models under high emissions (SSP5-8.5) are likely to eventually collapse. It should be noted that these likelihood estimates are not directly simulated but are inferred from model results, and likely include both linear declines as well as potential tipping-induced shutdowns. As such, they are not specific to reaching a tipping point, but more generally to AMOC shutdown.
Critically, they also are not direct probabilities for shutdown likelihoods in the real-world, only for those modelled worlds, in which varrious process and interactions key for resolving tipping are missing. If one assumes though that the model probabilities correspond with (or possibly under-estimate) real-world shutdown probabilities, and that we are on track for between intermediate and high emissions, then that would give somewhere around a 50+% chance of shutdown quoted.
How well did the media do in describing it?
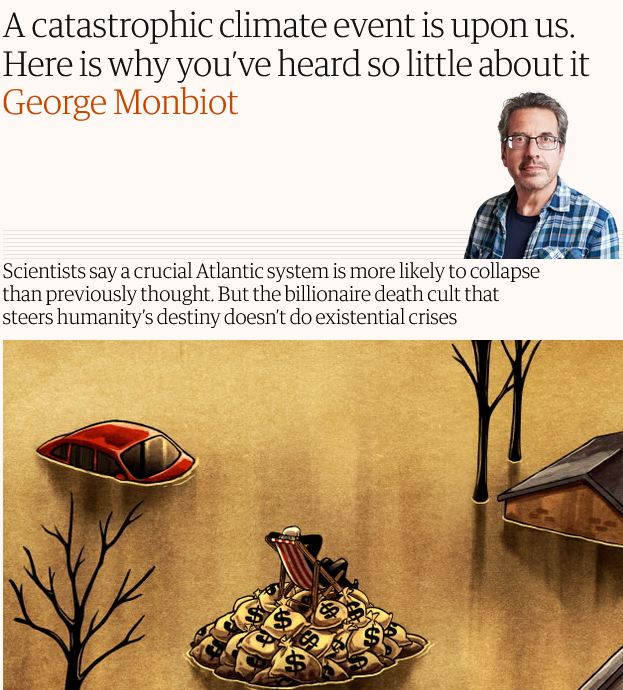
The Guardian reported that “the critical Atlantic current system appears significantly more likely to collapse than previously thought after new research found that climate models predicting the biggest slowdown are the most realistic“, with a linked column saying “Scientists say a crucial Atlantic system is more likely to collapse than previously thought“, and both quoting a comment by Stefan Rahmstorf of there being a “more than 50%” likelihood of shutdown. This coverage was broadly accurate (if talking about collapse from either linear decline or a tipping point), in that the average weakining expected by 2100 is higher in this study, making a total collapse beyond then more likely. However, and as noted in a subsequent Letter, the study itself doesn’t show a 50% likelihood of collapse, rather a ~50% decline by 2100, with collapse beyond then extrapolated.
The Independent reported that this “the Atlantic Ocean’s main current system is significantly more likely to collapse than previously thought“, and that “experts said that the Atlantic meridional overturning circulation (Amoc) could pass the shutdown tipping point within the next couple of decades, making a collapse inevitable” [emphasis added]. A linked summary went further, saying “Atlantic Ocean current collapse now ‘almost inevitable’” and “experts suggest the Amoc could reach a shutdown tipping point within decades“. However, the study itself did not show AMOC tipping occurring, just the degree of AMOC slowdown by 2100. While a 50% decline by 2100 does suggest long-term collapse is likely, this is an extrapolation with inevitability not demonstrated. and the likelihood of collapse (either due to tipping or linear decline) was not calculated. (For example, in the 2025 paper discussed above, even under extreme emissions collapse is highly likely but not inevitable in models.)
Channel 4 News stated that “Scientists put the chance of a catastrophic slowdown of AMOC by the end of the century at over 50%, plunging us into freezing winters and summer droughts that would limit our ability to grow food” [emphasis added]. As discussed above though, the over 50% figure in the study was for how much the AMOC is likely to weaken by 2100 under current warming trajectory, *not* the chance of slowdown or collapse. As with The Independent, it seems that the similarity of the two ~50% figures (for degree of slowdown in study, and likelihood of collapse per Stefan Rahmstorf’s assessment) has led to their conflation.
CNN‘s headline of “A vital system of Atlantic Ocean currents is weakening and closer to collapse than thought“, and that “The AMOC is on course to slow by more than 50% by the end of the century” more accurately reflects the study, focusing on greater weakening than expected, making its potential collapse sooner (albeit not directly modelled).
Overall then, coverage of this study was mixed – while the general headline of greater AMOC weakening being likely meaning collapse could happen sooner than thought was reasonable, several outlets mixed up the degree of weakening projected for 2100 with the likelihood of collapse at all, and conflated collapse in general with collapse specifically due to a tipping point. Most also did not contextualise results with other recent coverage suggesting AMOC collapse is less likely than thought, which could confuse some readers unless explained.
What’s next for AMOC research?
While evidence is growing that the AMOC is already weakening, and could be towards higher end of expectations, not all studies agree on to what extent weakening has begun, or how much it will weaken. Longer experiments have shown that the AMOC does reach a collapse level in many CMIP6 models, and that in some this is likely due to tipping dynamics, but longer runs are missing for most models. And the big issue remains that it is hard to robustly estimate the real-world likelihood of AMOC tipping when models lack key processes for ocean overturning. New generation high resolution models are increadingly allowing ocean ‘eddies’ to be resolved, which will help, as will efforts to reduce particular model biases, but a key missing interaction is the influence of Greenland meltwater on the North Atlantic.
There is also some continuing debates around definitions and framings. As seen above, AMOC collapse is often used synonymously with AMOC tipping, but the latter is just one way the AMOC can collapse, with a direct linear decline to a collapse-consistent level common in models. This also came up in the discussion around this study last year, which had results broadly consistent with this current study (with a 54% decline over 90 years of an extreme emission scenario), but was framed instead around collapse being unlikely this century even under high emissions, and on how overturning circulations in other ocean basins shift to compensate. Even the usefulness of the terms ‘collapse’ and ‘shutdown’ are debated, even if the literature fairly consistently uses an 80% decline (or reaching less than 6 Sverdrups) for the latter.
Overall though, there is some common ground in recent research: evidence for AMOC weakening having begun is growing, albeit is not clear in every AMOC metric; a substantial decline is expected with current emissions, that over centuries could potentially push the AMOC to a slow ‘shutdown’ state; and there remains a real but uncertain chance that this slowdown could pass a tipping point beyond which this shutdown is locked in, even if warming is halted or even declines. Exactly how much and quickly the AMOC is weakening, and the likelihood of it reaching a tipping point, remain much more uncertain, but what we do know is enough to justify concern and action to reduce the risk of AMOC shutdown.
~
This post was written by Dr. David Armstrong McKay, a Lecturer (Assist. Prof.) in Geography, Climate Change and Society at the University of Sussex, and an Associate at Stockholm Resilience Centre and the University of Exeter’s Global Systems Institute.
Post change log: 15/6/26 edits to final section to clarify terminological debate.
